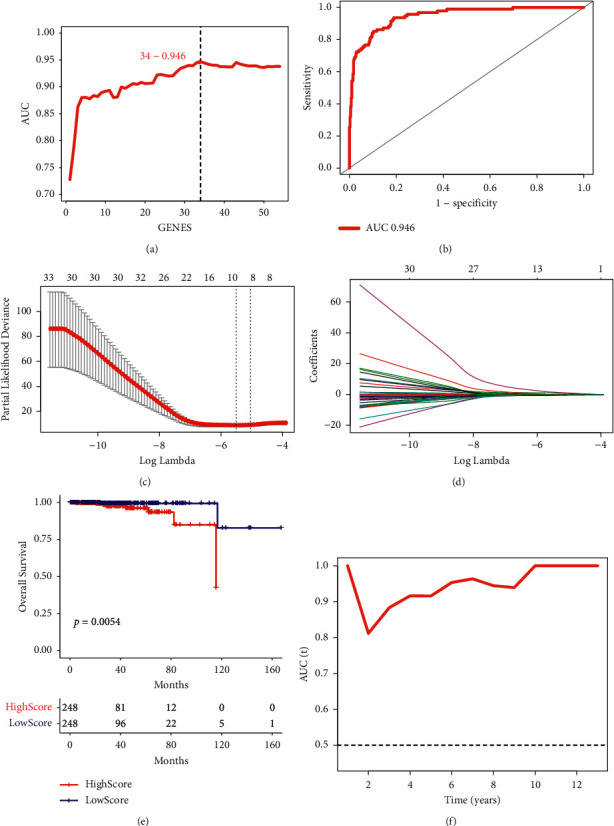
Figure 2.

Screening of genes closely related to the prognosis of PC. (a) A different analysis of the two types of transcription factors. (b) ROC curve. (c) and (d) Lasso analysis. (e) Kaplan-Meier analysis. p < 0.05 indicated that there was a significant difference in survival rate between the two groups. (f) AUC value. PC, prostate cancer; ROC, receiver operating characteristic; AUC, area under the curve.
