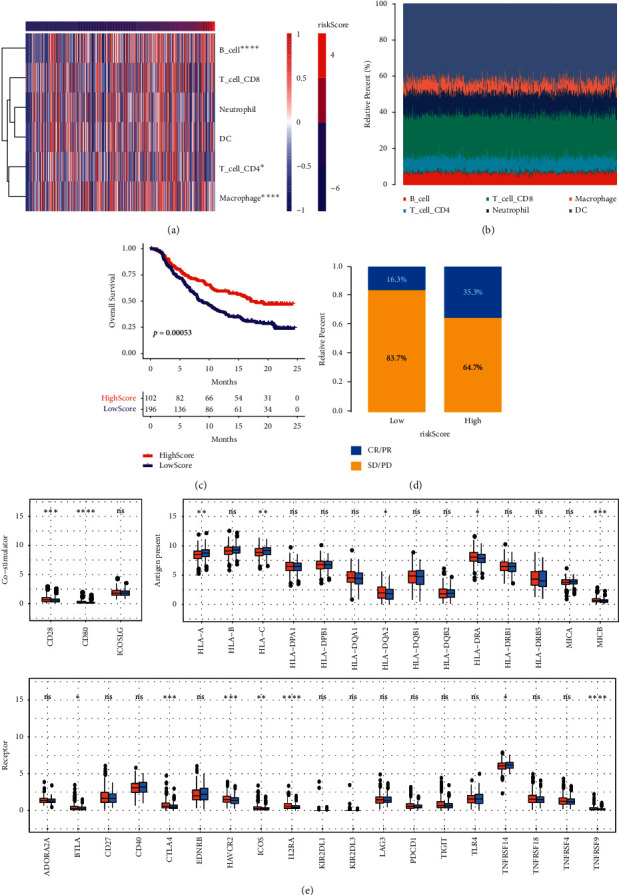
Figure 4.

The correlation between risk score model and immune cells. (a) Heat map. (b) The proportion of cells in each sample. (c) Survival analysis. p < 0.05 indicated that there was a significant difference in the survival rate between the two groups. (d) The relative percentage of CR/PR and SD/PD in the high- and low-risk score. (e) Analysis of immune checkpoints at different levels. ∗p < 0.05. ∗∗p < 0.01. ∗∗∗p < 0.001. ∗∗∗∗p < 0.0001. CR, complete response; PR, partial response; PD; SD.
