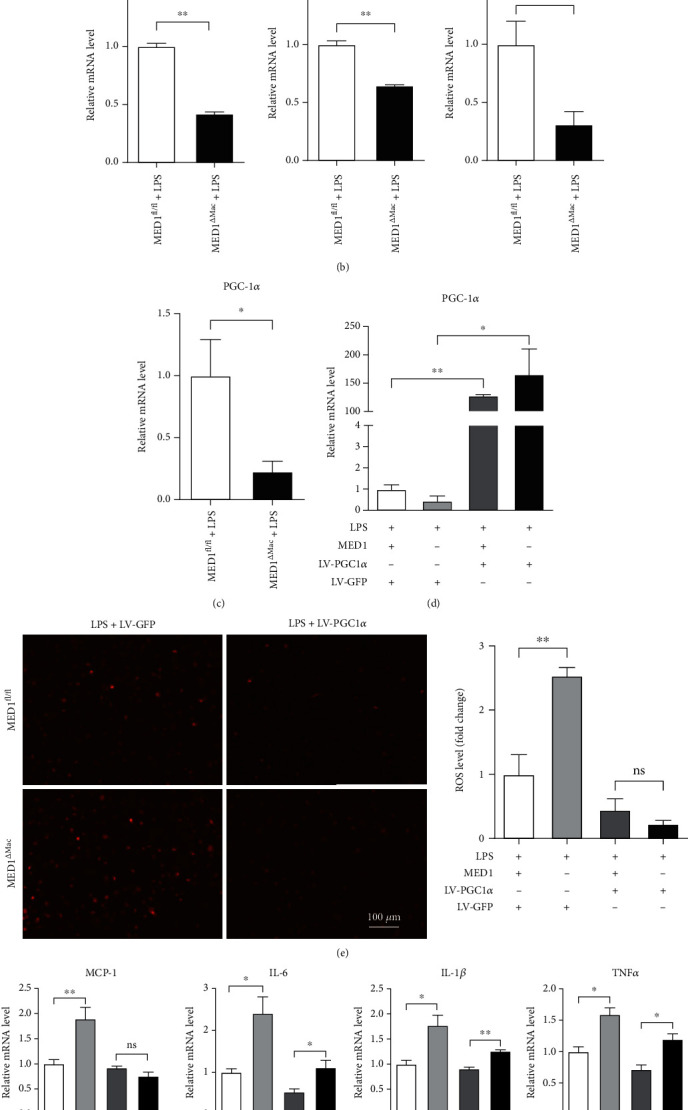
Figure 4.

MED1 deficiency increases LPS-induced ROS generation. (a) Peritoneal macrophages from MED1fl/fl or MED1ΔMac mice were cultured in RPMI-1640 medium for 24 h followed by treatment with or without LPS and then incubated with the DCFH-DA probe (20 μmol/L) at 37°C for 30 min. (a, left) Representative images were taken using a fluorescence microscope. (a, right) The mean of green fluorescence intensity in each cell was quantified using ImageJ and normalized to control. (b) qRT-PCR analysis of catalase (Cat), glutathione reductase (Gsr), and superoxide dismutase 2 (SOD2) in peritoneal macrophages from MED1fl/fl or MED1ΔMac mice treated with LPS (50 ng/mL) for 6 h. (c) qRT-PCR analysis of PGC1α levels in MED1fl/fl and MED1ΔMac macrophages treated with LPS. (d) qRT-PCR analysis of PGC1α and MED1 levels in MED1fl/fl and MED1ΔMac macrophages with or without overexpression of PGC1α. All four groups were treated with LPS. (e) Representative dihydroethidium staining of MED1fl/fl and MED1ΔMac macrophages with or without overexpression of PGC1α. All four groups were treated with LPS. (f) qRT-PCR analysis of MCP-1, IL-6, IL-1β, TNFα, COX2, and ICAM1 levels in MED1fl/fl and MED1ΔMac macrophages with or without overexpression of PGC1α. All four groups were treated with LPS. The data are expressed as the mean ± SEM (n = 6–8). ∗p < 0.5; ∗∗p < 0.01.
