
Figure 7.
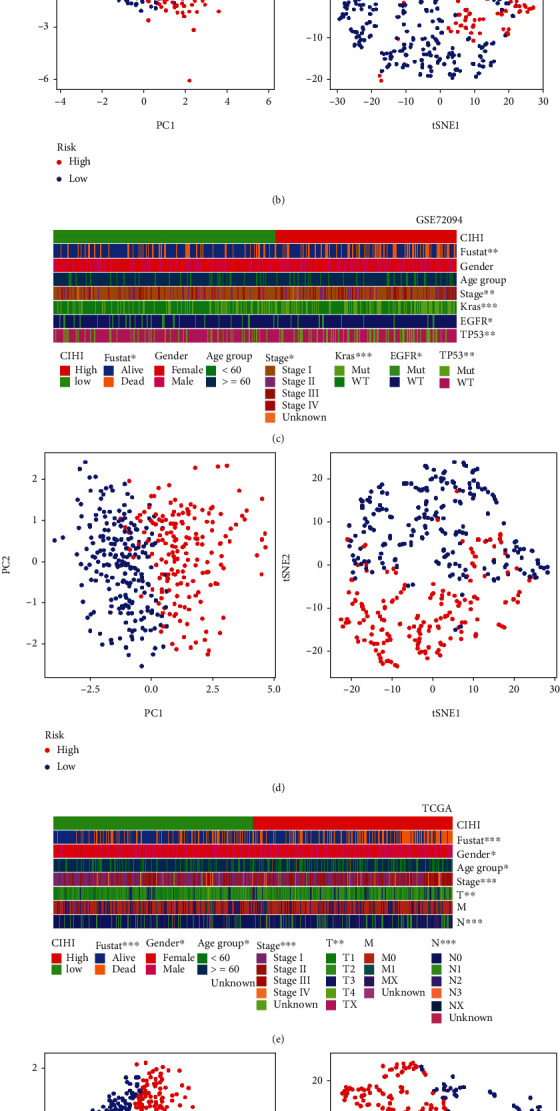
Composite heatmaps of CIHI and clinicopathological features in LUAD patients. (a) Heatmap of differences in clinicopathological factors and high- and low-CIHI groups in the GSE68465 cohort. (b) PCA analysis and t-SNE analysis in the GSE68465 cohort. (c) Heatmap of differences in clinicopathological factors and high- and low-CIHI groups in the GSE72094 cohort. (d) PCA analysis and t-SNE analysis in the GSE72094 cohort. (e) Heatmap of differences in clinicopathological factors and high- and low-CIHI groups in TCGA cohort. (f) PCA analysis and t-SNE analysis in TCGA cohort. ∗p < 0.05, ∗∗p < 0.01, and ∗∗∗p < 0.001.