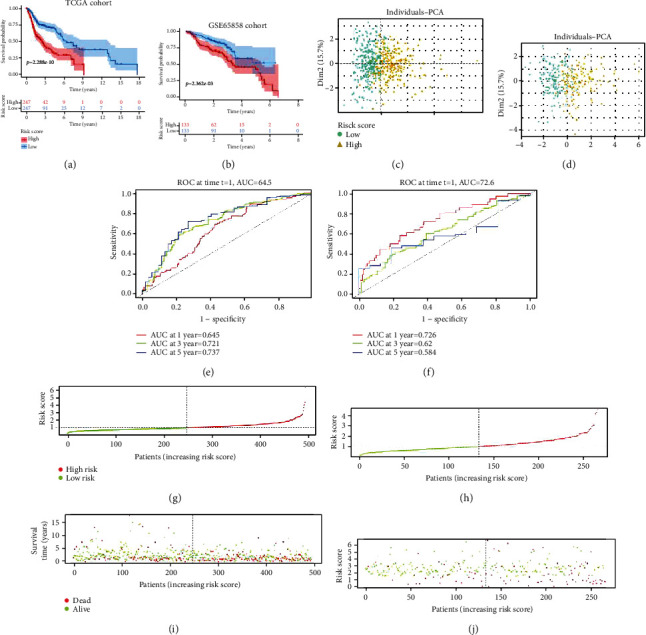
Figure 3.

Validation of the prognostic model. (a, b) The Kaplan-Meier survival analysis of the high-risk and low-risk groups in The Cancer Genome Atlas (TCGA) and GSE65858 datasets. (c, d) Principal component analysis of the high-score and low-score groups in TCGA and GSE65858 datasets. (e, f) The area under the curve values for the 1-year, 3-year, and 5-year survival rates of TCGA and GSE65858 datasets. (g, h) The risk score distribution curve of high-risk and low-risk groups in TCGA and GSE65858 datasets. (i, j) Scatter plot indicating the association between survival time and risk score in TCGA and GSE65858 datasets.
