Figure 9.

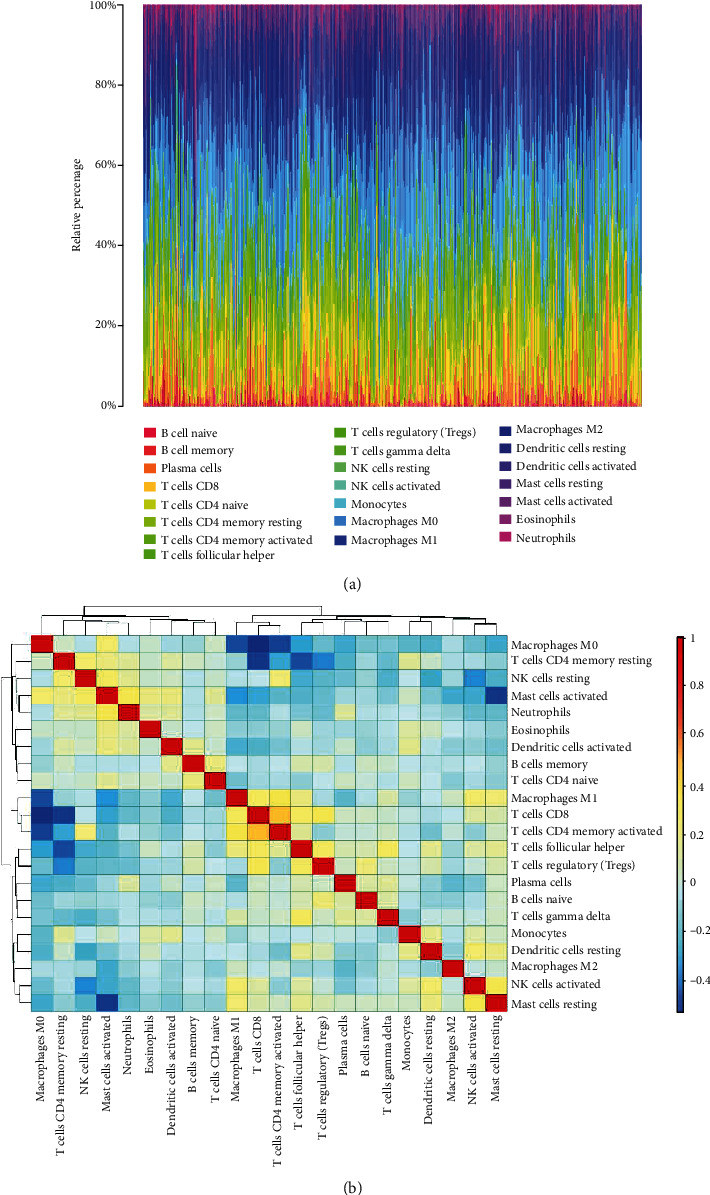
CIBERSORT analysis of The Cancer Genome Atlas (TCGA) cohort. (a) Histogram of relative proportions of 22 tumor immune cells (TICs). (b) Correlation among 22 tumor immune cells (TICs).

CIBERSORT analysis of The Cancer Genome Atlas (TCGA) cohort. (a) Histogram of relative proportions of 22 tumor immune cells (TICs). (b) Correlation among 22 tumor immune cells (TICs).