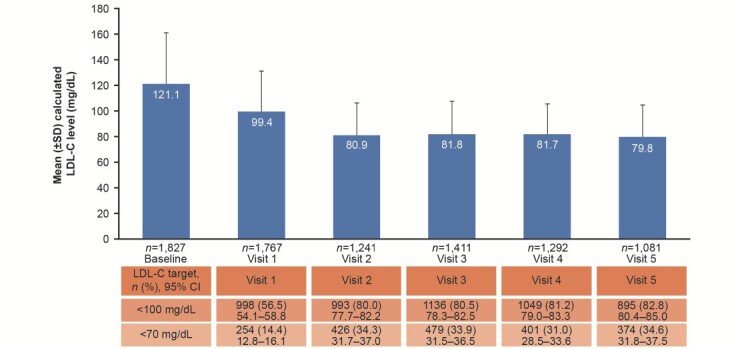
Fig.2. Mean (±SD) LDL-C levels over 2 years of follow-up, plus the proportions of patients achieving LDL-C target levels.

CI, confidence interval; LDL-C, low-density lipoprotein cholesterol; SD, standard deviation.

CI, confidence interval; LDL-C, low-density lipoprotein cholesterol; SD, standard deviation.