Fig.2.

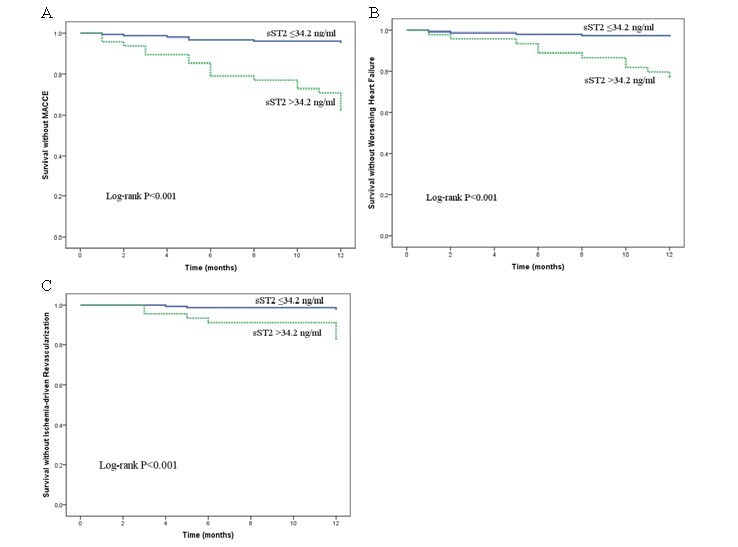
Kaplan–Meier survival curves for the relation between sST2 and MACCE (A), between sST2 and worsening HF (B), and between sST2 and ischemia-driven revascularization (C)

Kaplan–Meier survival curves for the relation between sST2 and MACCE (A), between sST2 and worsening HF (B), and between sST2 and ischemia-driven revascularization (C)