Fig. 6.
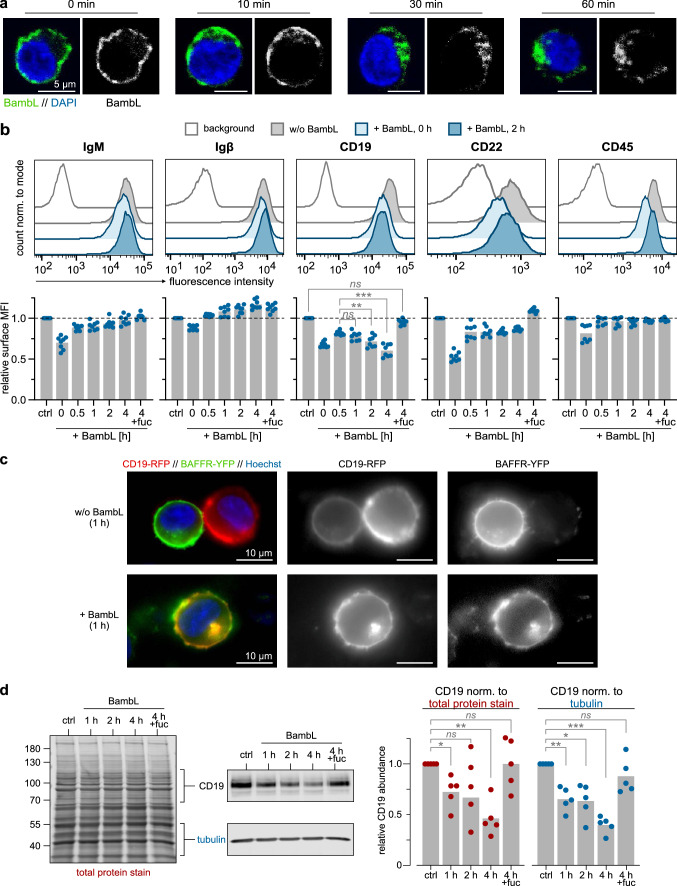
BambL is internalized and depletes surface and total CD19. a B cells internalize BambL. Ramos cells were loaded with BambL-488 (green) on ice, washed and transferred to warm medium to reinitiate internalization processes. Cells were fixed after indicated time points, counter-stained with DAPI (blue) and mounted for confocal microscopy. Representative confocal sections demonstrate a homogenous lectin distribution on the cell surface at time point 0 min, followed by an internalization wave and accumulation near the nucleus within 60 min. Scale bars: 5 µm. b BambL depletes surface CD19. Ramos cells were loaded with BambL on ice, washed and incubated in warm medium for indicated durations until flow cytometric analysis of surface proteins. As controls, cells were left without lectin (‘ctrl’) or BambL was supplemented with excess L-fucose (‘4 h + fuc’). Cells for time point “0 h” were loaded with lectin, washed and then analyzed without incubation in warm medium. Representative fluorescence histograms of four conditions are presented in the upper row. Bars below are mean fold changes of geometric mean fluorescence intensities (MFI) relative to ‘ctrl’ samples (n = 8). Statistical significance (2-way ANOVA with Dunnett’s correction): ns (p > 0.05), ** (p ≤ 0.01), *** (p ≤ 0.001). c B cells internalize CD19 upon BambL stimulation. Transfected BJAB cells expressing CD19-RFP and BAFFR-YFP were stimulated with BambL for 1 h (controls were left unstimulated), then imaged with a widefield microscope. Representative images demonstrate the internalization of both CD19 and BAFFR. d BambL induces degradation of internalized CD19. Ramos cells were incubated with BambL for indicated durations and analyzed in western blots. To control for differences in sample loading, the CD19 band intensities were normalized once to their total protein signal per lane (left image), once to tubulin. Bars are mean fold changes relative to unstimulated controls (n = 5). Either normalization strategy yielded a significant loss of total CD19 abundance over time. Statistical significance (2-way ANOVA with Dunnett’s correction): ns (p > 0.05), * (p ≤ 0.05), ** (p ≤ 0.01), *** (p ≤ 0.001)

