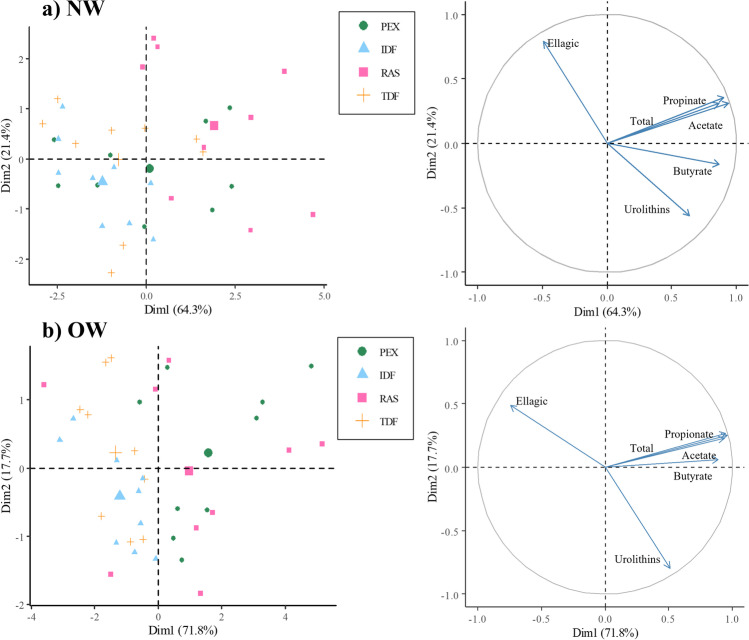
Fig. 2.
Principal component analysis (PCA) showing individual distribution (on the left) and variables distribution (on the right) for selected variables (Δ ellagic acid, urolithin A, acetate, propionate, butyrate and total SCFAs) in normal-weight volunteers (a NW) and overweight volunteers (b OW). Different colours show different fractions: PEX (
 polyphenol extract), IDF (
 insoluble dietary fibre), RAS (
 whole raspberry), TDF (
 total dietary fibre)

