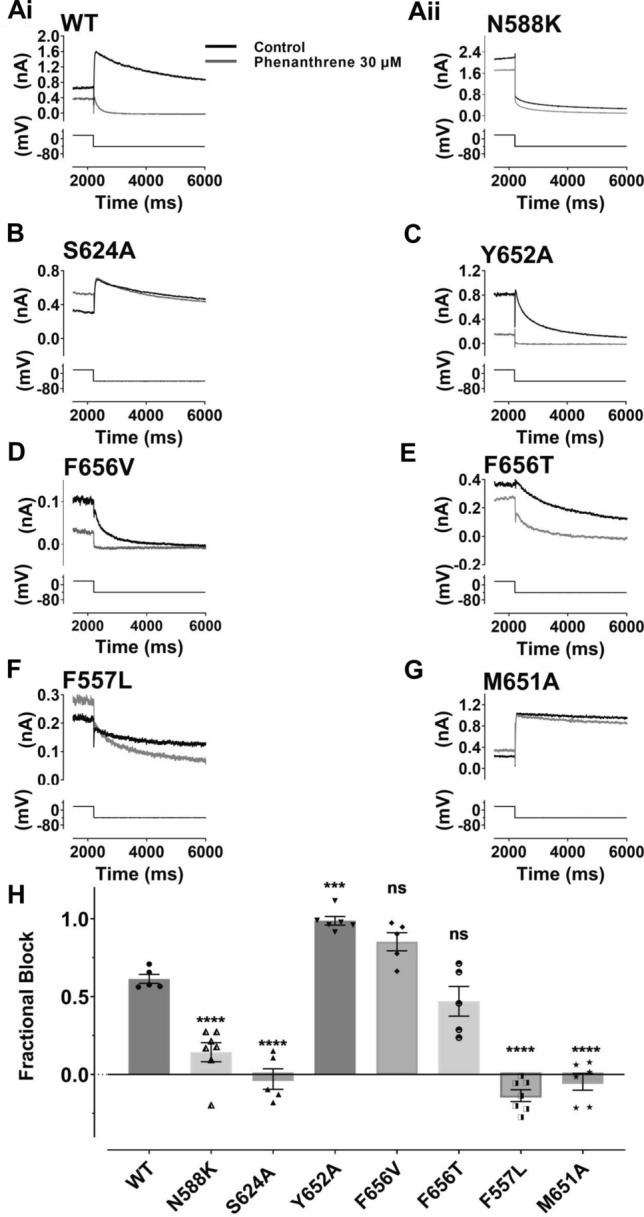
Fig. 5.

Effect of hERG mutations on the inhibitory effect of phenanthrene on IhERG. A–G show representative tail current traces (upper) for control IhERG (black) and during application of 30 µM Phen IhERG (grey), elicited by same voltage protocol used for Fig. 1 (lower) as described. Ai: wild type (WT), Aii: N588K, B S624A, C Y652A, D F656V, E F656T, F F557L and G M651A. H Bar chart shows extent of mean tail current block by 30 µM for WT, N588K, Y652A, S624A, F656V, F656T, F557L and M651A IhERG respectively. One way ANOVA (F = 61.2, p < 0.0001). Significance for post hoc Bonferroni comparisons of each mutant with WT is denoted by asterisks ****p < 0.0001, ***p < 0.001 (WT n = 5, N588K n = 7, Y652A n = 6, S624A n = 5, F656V n = 5, F656T n = 5, F557L n = 7 and M651A n = 6). Bar charts show mean ± SEM values, with individual experimental values for each mutant superimposed as the different symbols overlying the plotted bars
