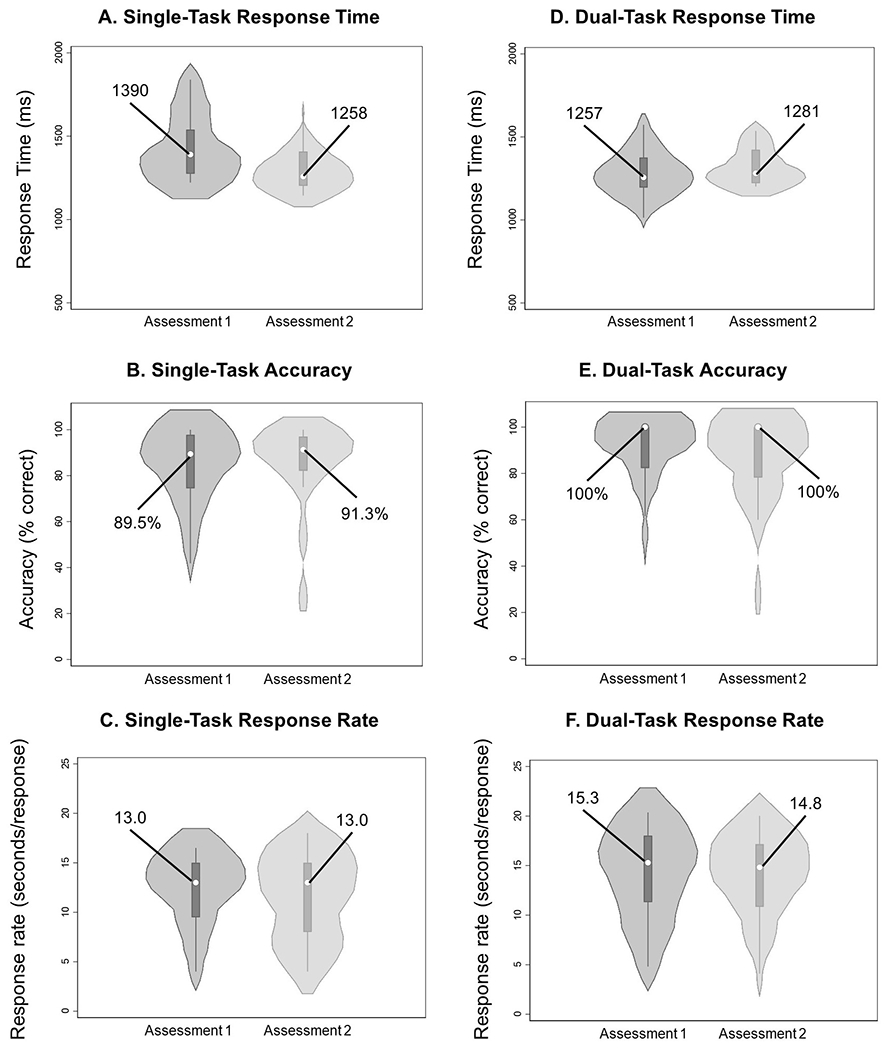
Figure 2.

Violin plots describing Stroop primary outcome variables (accuracy, response time, response rate) under single-task (A, B, C) and dual-task (D, E, F) conditions at each time point. Violin plots describe the distribution of measurements in each group, and data are presented as median (center dot, with corresponding number included) and interquartile range (box around the median). The shaded area represents the probability density of data at each level of the scale, smoothed using a kernel density estimator.
