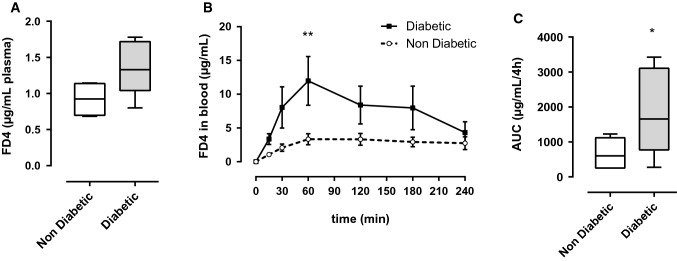
Fig. 2.
In vivo measurements of intestinal passage to FITC-Dextran 4 kDa (FD4). A Plasmatic FD4 concentration 4 h after gavage by 750 µg FD4/g bodyweight, unpaired students t-test, p = 0.0809, n = 4–5. B Kinetic of FD4 fluorescence in blood during 4 h after gavage by 750 µg FD4/g bodyweight, repeated-measurement two-way ANOVA, **p < 0.01, n = 5–6. C Area under the curve (AUC) of FD4 in blood during 4 h after FD4 gavage, unpaired students t-test, p = 0.0499, n = 5–6

