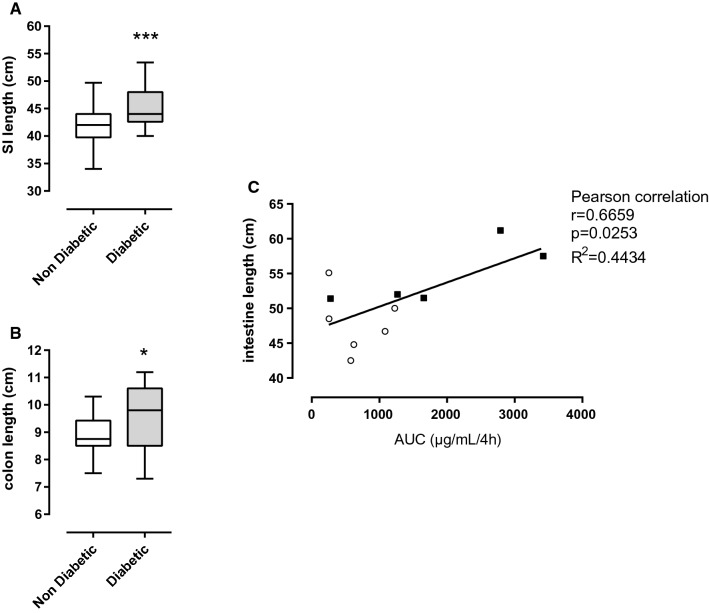
Fig. 3.
Macroscopical analysis of intestine and correlation between intestinal length and Area Under the Curve (AUC) of FITC-Dextran 4 kDa (FD4) concentration in blood, in diabetic vs. non-diabetic NOD mice. A Small intestine length (cm), unpaired students t-test, p = 0.0009, n = 25–26. B Colon length (cm), Mann–Whitney test, p = 0.0306, n = 25–26. (C) Total intestinal length (cm) is positively correlated with the area under the curve (AUC) of FD4 concentrations during the 4 h after FD4 gavage, Pearson correlation, r = 0.6659, R2 = 0.4434, p = 0.0253, n = 11, non diabetic: empty circles, diabetic: filled squares

