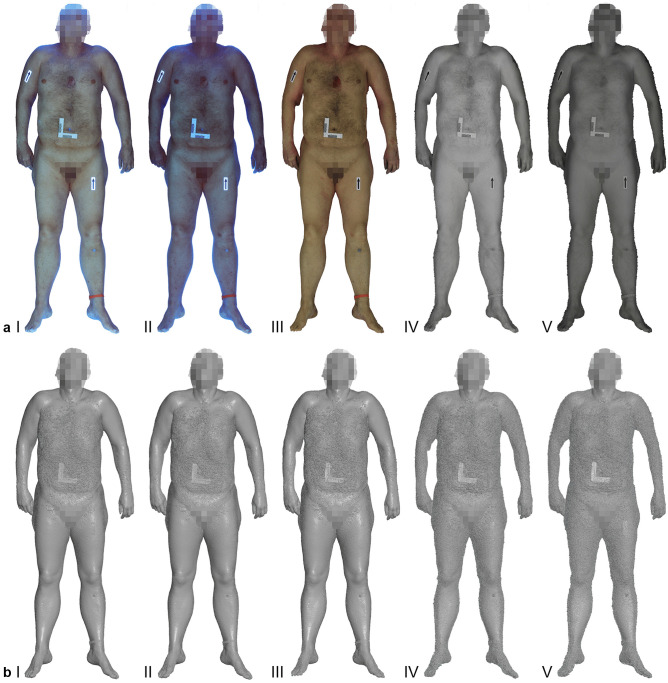
Fig. 2.
Comparison of the textured 3D models (a I-V) and the corresponding 3D polygonal mesh representations (b I-V) from the entire multispectral imaging set for case one. Images a I and b I refer to the UV-I dataset at 365 nm. Images a II and b II refer to the UV-I dataset at 400 nm. The VIS dataset is represented by images a III and b III. The remaining image sets of a IV/b IV and a V/b V refer to the NIR dataset at 860 nm and 960 nm, respectively

