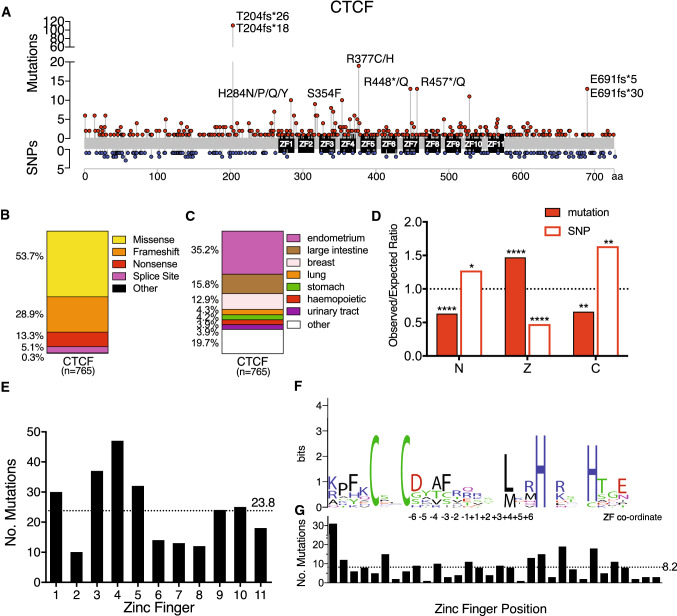
Fig. 1.
Distribution and impact of CTCF somatic mutations in cancer. A The landscape of somatic mutations (above) and SNPs (below) occurring in CTCF: the distribution and frequency within the coding region is shown, recurrent somatic mutations (occurring 10 times) are labelled. For a curated list of non-redundant CTCF mutations from cancer genome sequencing studies (TCGA, COSMIC) and published studies see Supplementary Table 1. CTCF mutation type (B); and tissue distribution (C) are shown; n = total number of mutations. D Analysis of cancer-related somatic missense variants and missense SNPs occurring in each domain of CTCF (N=N-terminus; Z=ZF domain; C=C-terminus). The expected occurrence was calculated from the total number with the proportion of missense variants expected in each domain if they were evenly distributed. The observed/expected ratio confirms if there is a de-enrichment (< 1.0) or an enrichment (> 1.0) of non-synonymous changes. E Frequency of somatic missense mutations occurring in specific ZFs of CTCF, the mean for all ZFs is shown (dotted line). F Sequence logo of all 11 aligned CTCF ZFs; numbers (− 6 to + 6) indicate co-ordinates within the DNA-binding portion of the ZF. Similar amino acids are coloured: black—hydrophobic (G, A, V, I, L, P, W, F, M); green—polar (S, T, Y, C); purple—polar amide (Q, N); blue—basic (K, R, H); and red—acidic (D, E). The height of each amino acid residue is proportional to its observed frequency. The overall height of each letter ‘stack’ is proportional to the sequence conservation, shown in bits. G Frequency of missense somatic mutations at each ZF position; the mean for all ZFs is shown (dotted line). Data represent the mean ± SD with statistical analysis performed using the Chi-square test (*p < 0.05; **p < 0.01; ****p < 0.0001)

