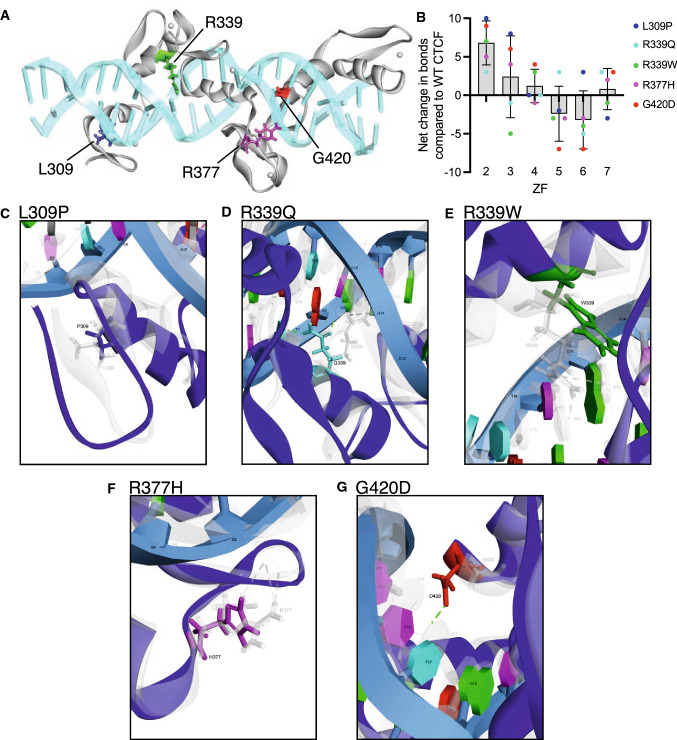
Fig. 5.
Homology modelling of CTCF ZF mutations. A CTCF ZF residues impacted by somatic mutation are depicted on the crystal structure model of ZFs 2–7 in association with DNA. Zinc molecules are shown as grey spheres. B Net change in bonds in individual CTCF ZFs following specific ZF mutations. Data shows the mean ± SD. C–G Overlay images of the normal (WT, grey) and mutant (blue) residues superimposed on the CTCF crystal structure: C L309P (L grey, P dark blue); D R339Q (R grey, Q cyan); E R339W (R grey, W green); F R377H (R grey, H magenta); G G420D (G grey, D red). Dashed lines indicate hydrogen bond pairing: old (grey) and new (green). DNA bases and their position relative to the 5′ end of the CTCF consensus are shown

