
Figure 1. Single-cell analysis of prostate epithelial heterogeneity.
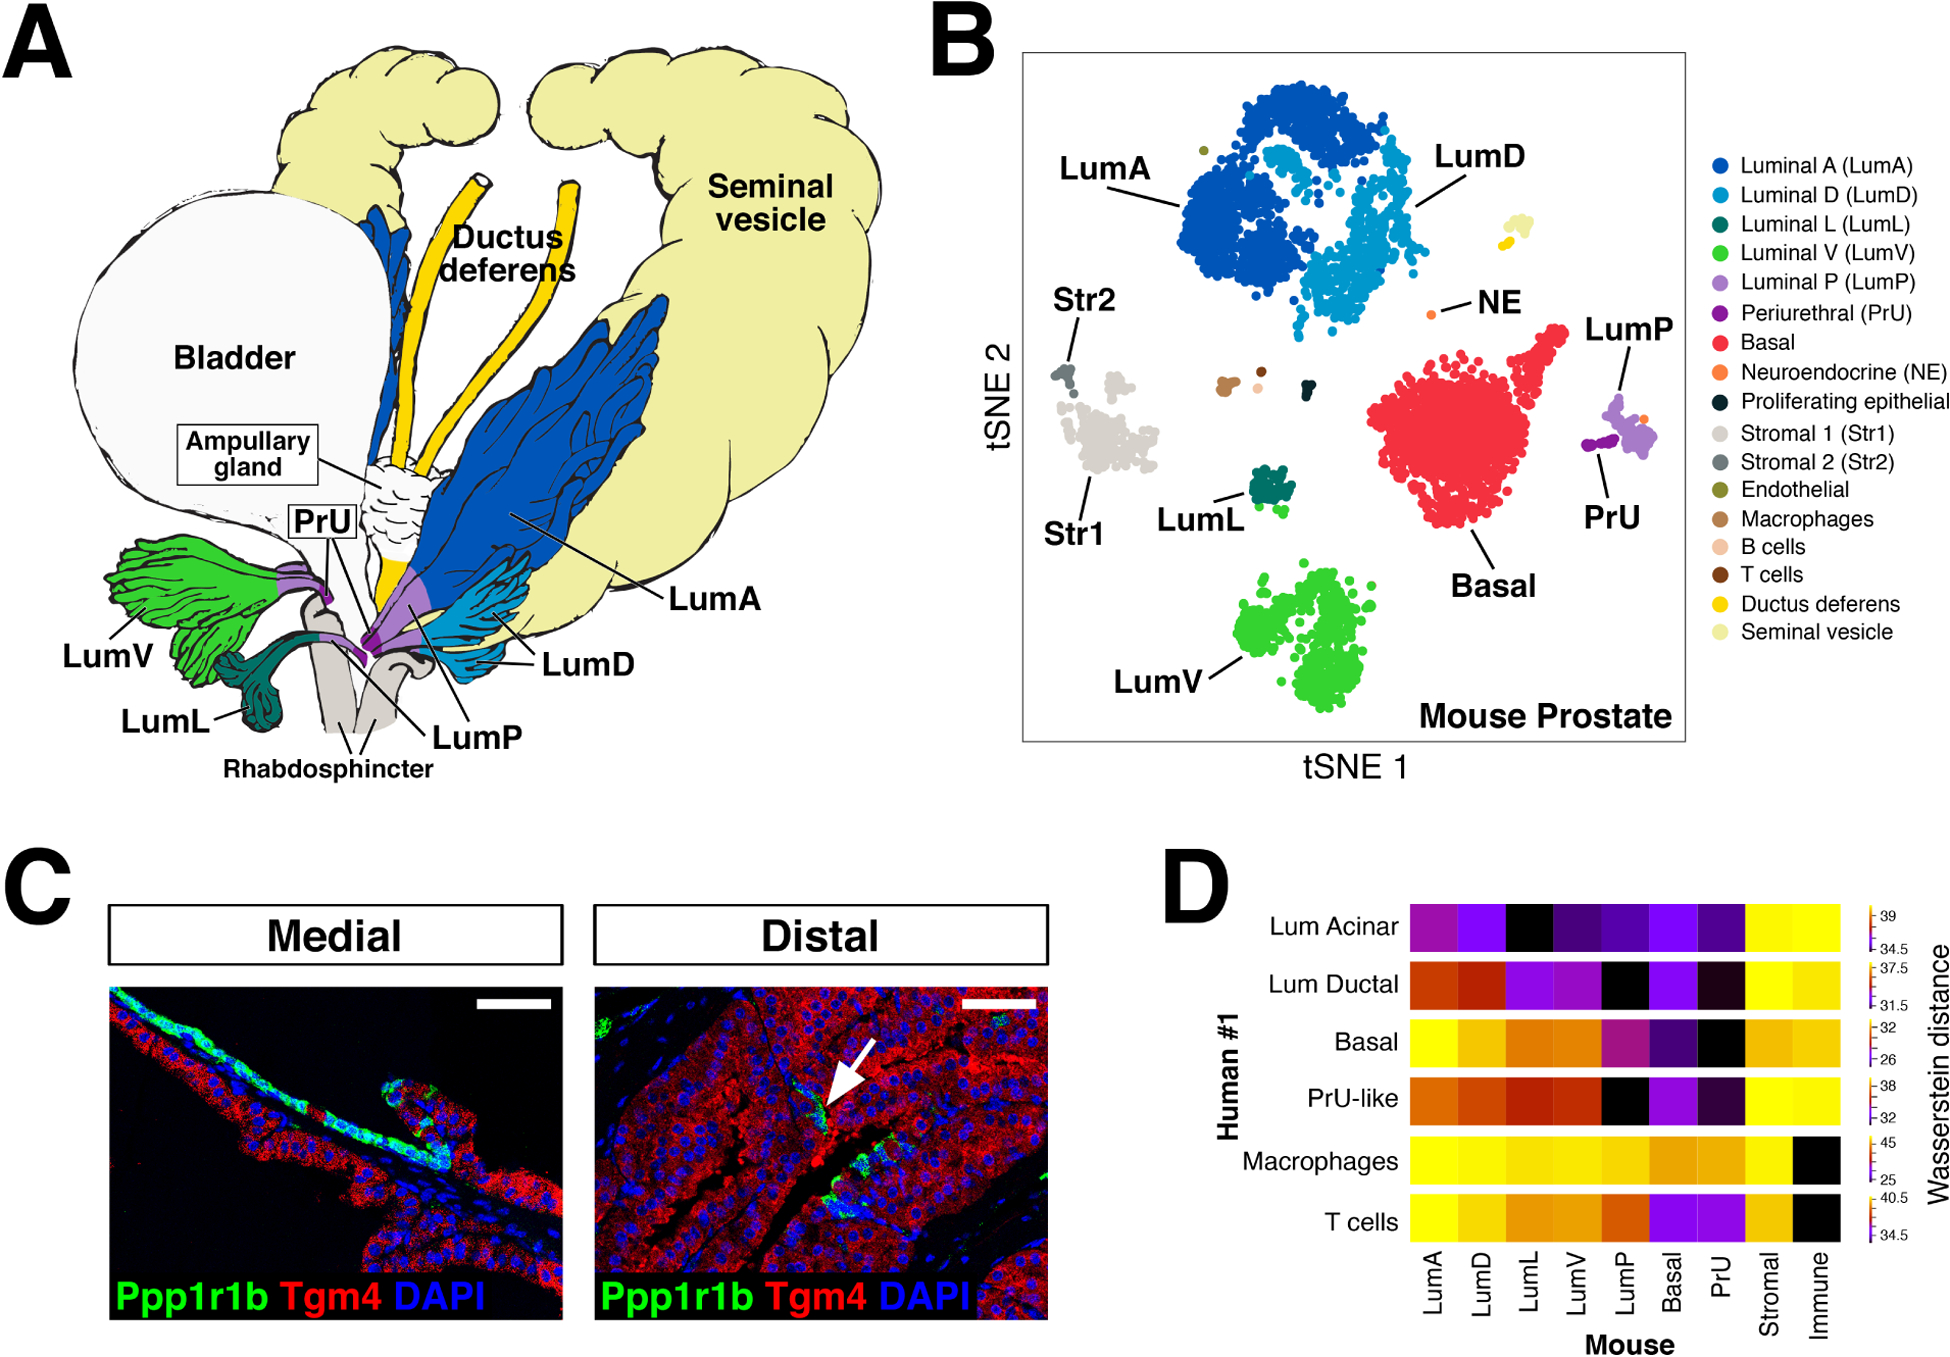
(A) Schematic model of prostate lobes, with the urethral rhabdosphincter partially removed to show the distribution of luminal epithelial populations as indicated. (B) t-distributed stochastic neighbor embedding (tSNE) plot of 5,288 cells from an aggregated dataset of two normal mouse prostates. (C) Immunofluorescence staining of a mouse dorsal prostate lobe, showing proximal luminal cells marked with Ppp1r1b and a medial border between proximal and distal luminal cells. (D) Heatmap visualization of transcriptional Wasserstein distances (also known as earth mover’s distances); this metric corresponds to transcriptional differences between populations, where less distance indicates transcriptional similarity, and greater distance indicates dissimilarity) between human and mouse prostate populations. Adapted from [8].