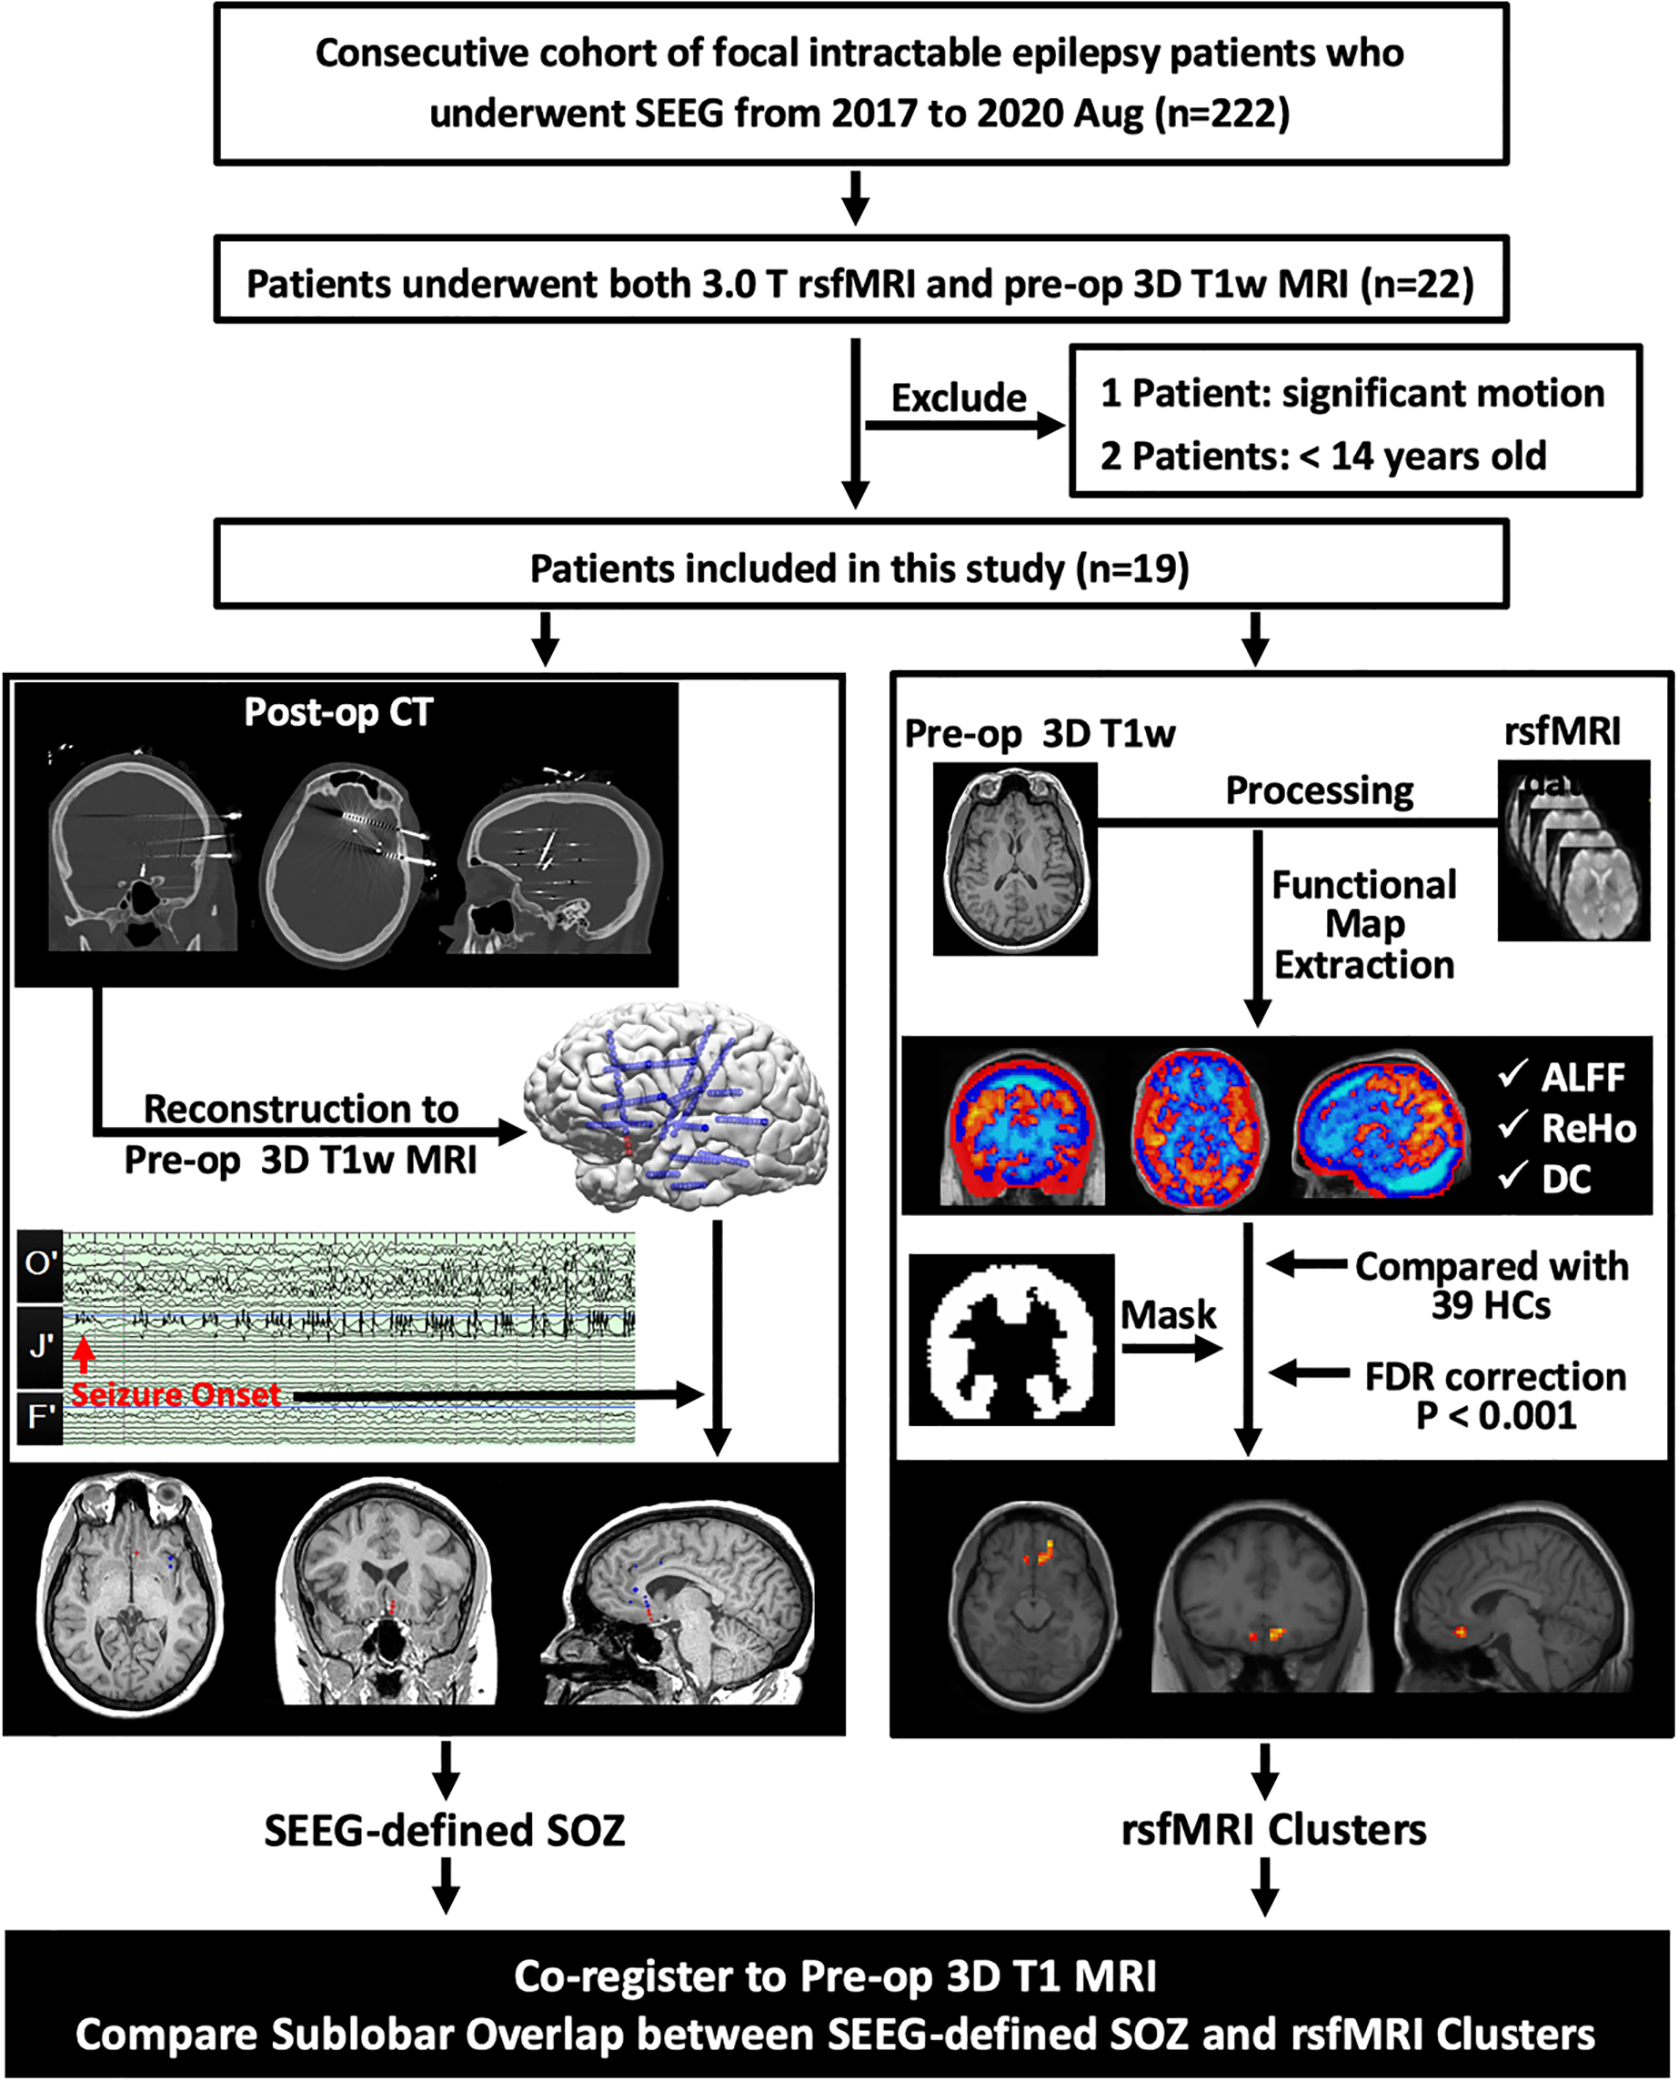
Figure 1:

Workflow of data collection, processing and analysis. Patients were included from a consecutive cohort of medically intractable focal epilepsy patients with SEEG implantation. SEEG-defined SOZ contacts were retrieved from the finalized clinical report after consensus discussion at the patient management conference. RsfMRI clusters were generated for each patient by comparison with 39 HCs. ALFF, ReHo and DC clusters underwent concordance assessment with the SEEG-defined SOZ.
SEEG= Stereo-electroencephalography; rsfmri= resting-state functional magnetic resonance imaging; Pre-op= preoperative; 3D= three dimensional; T1w= T1-weighted; Post-im= post-implantation; CT= computed tomography; SOZ= seizure onset zone; ALFF= amplitude of low-frequency fluctuations; ReHo= regional homogeneity; DC= degree centrality; HCs= healthy control subjects; FDR= False Discovery Rate.
