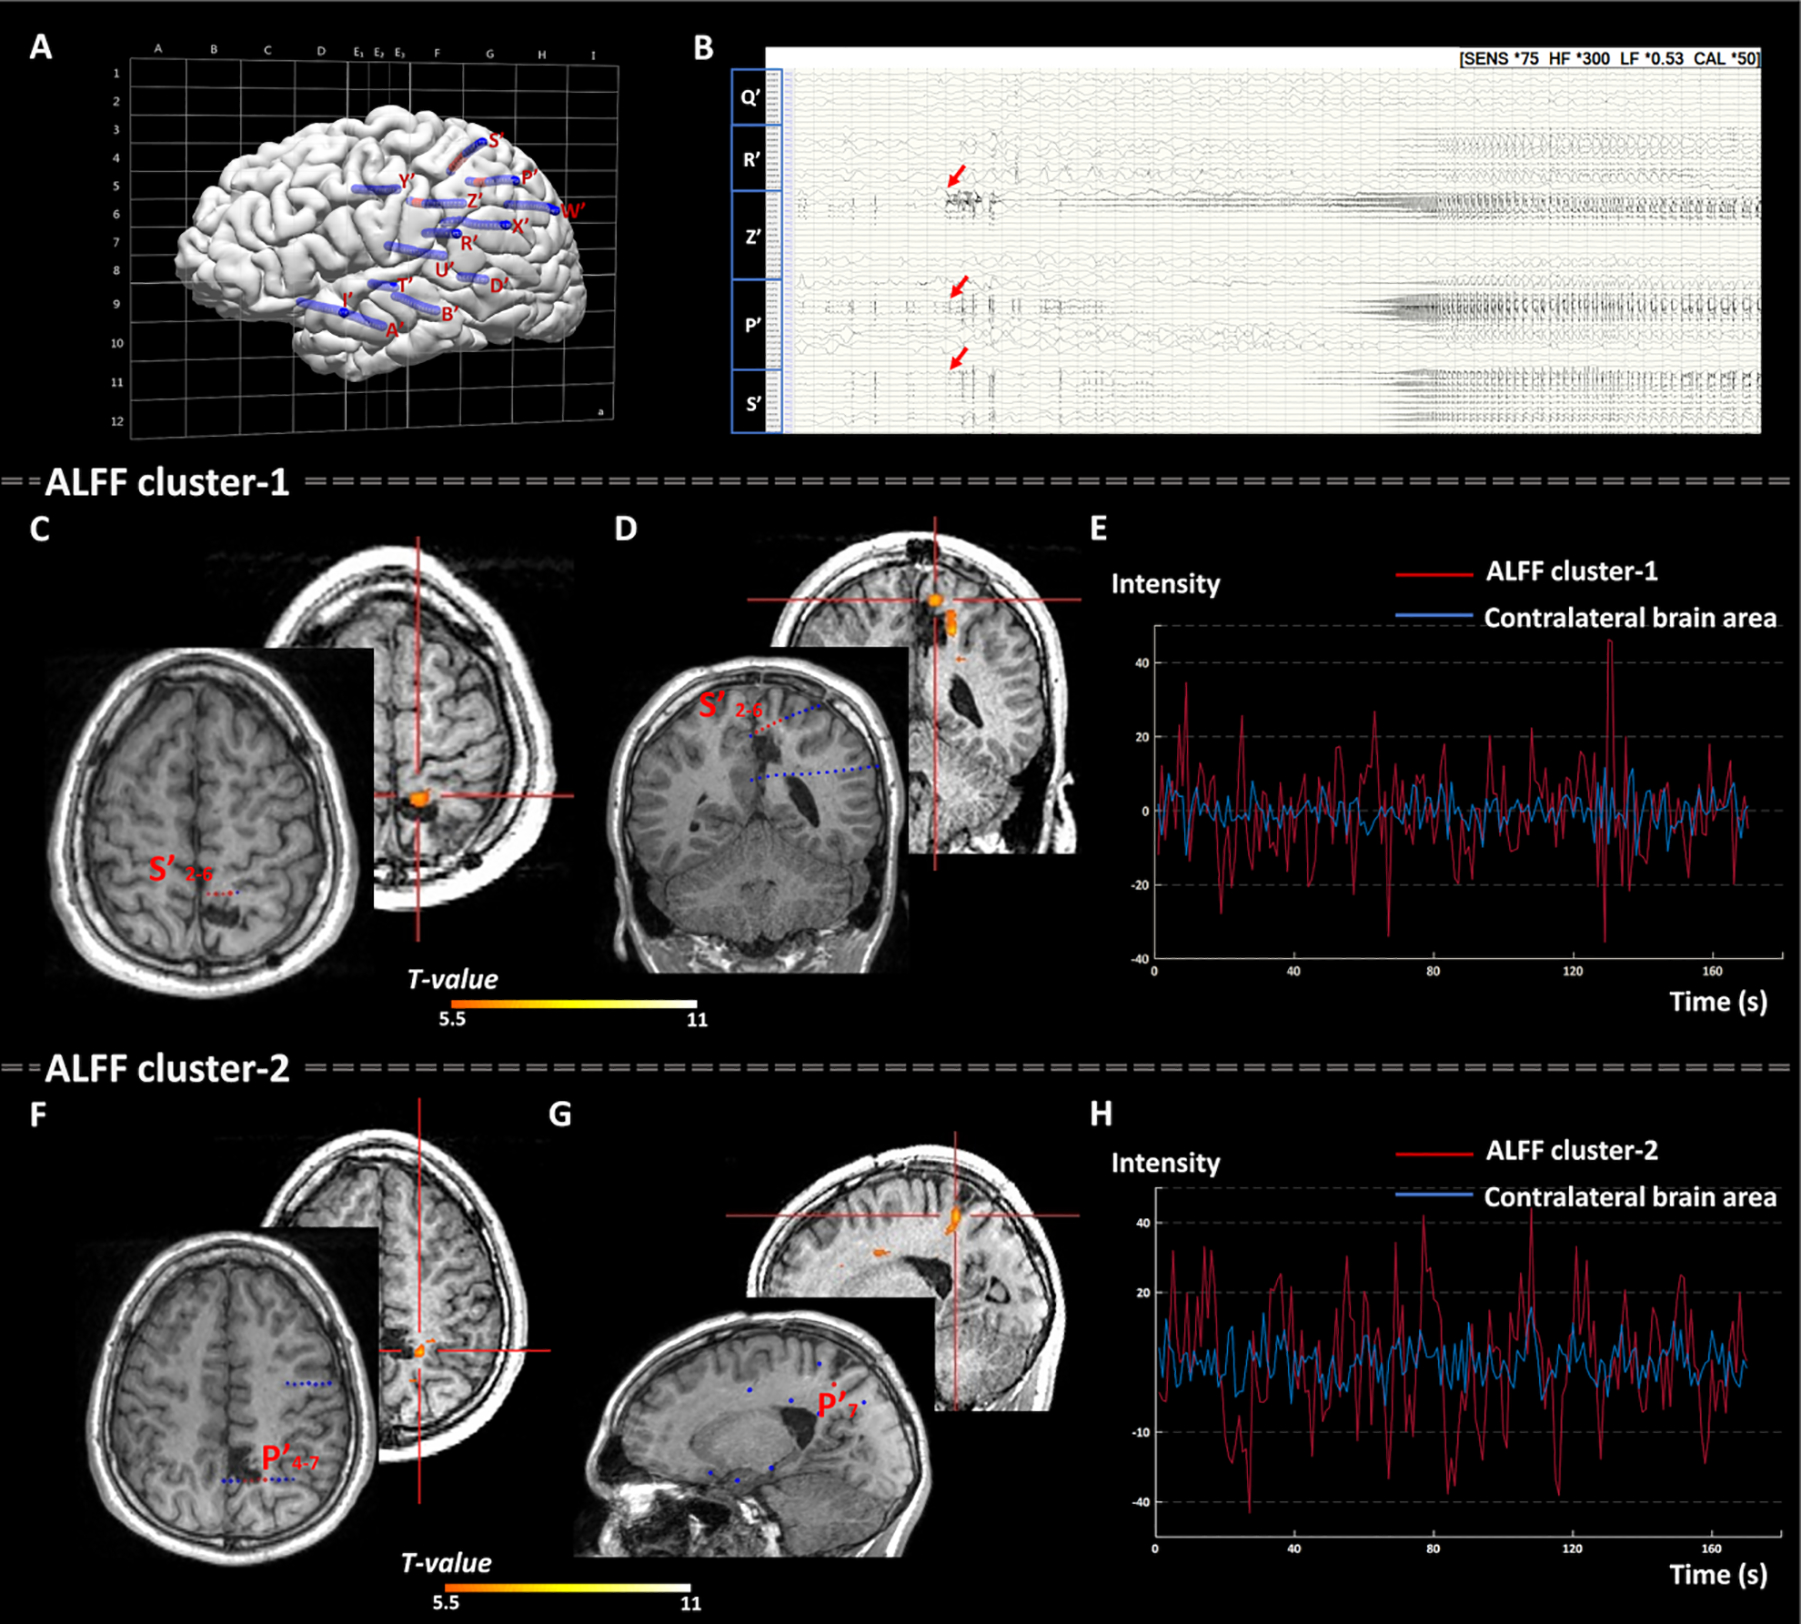
Figure 3:

Representative case 2: Illustration of two concordant ALFF clusters with the SOZ defined by SEEG in a patient with non-lesional MRI (P7 in table 1). SEEG was implanted based on the hypotheses including the posterior perisylvian, posterior insular/operculum, mesial parietal and cingulate areas in the left hemisphere. A) SEEG implantation map shown with Talairach grid superimposed, including 14 electrodes and 186 contacts (contacts indicating SOZ marked with red, other contacts marked with blue). B) Bipolar montage of relevant SEEG channels (50-second epoch): Typical seizure showed onset involving primarily contacts Z’3–5 (cingulate gyrus), P’4–7 and S’2–6 (dorsomedial parietal region) characterized by preictal spiking followed by EEG attenuation and paroxysmal fast discharge. C) Axial view and D) coronal view: ALFF cluster-1 with peak intensity, indicated by the red crossbar, concordant with the SOZ (noted by the red SEEG contacts S’2–6). F) Axial view and G) sagittal view: ALFF cluster-2 with 2nd peak intensity, indicated by the red crossbar, concordant with the SOZ (noted by the red SEEG contacts P’4–7). E) and H): time series graphs for ALFF cluster-1 and cluster-2 plotted separately to show the BOLD signal fluctuation versus time in seconds. Time series were extracted from the SOZ-concordant ALFF activation clusters in the left supramarginal gyrus (red line) both showed significantly higher amplitude than that from the corresponding contralateral brain area (blue line), suggesting increase of regional neural activities within the SOZ. As shown in panels C, D, F and G, the 2 ALFF clusters and SEEG contacts were co-registered to the postoperative MRI. This patient didn’t gain seizure-free due to the incomplete resection of the SEEG-defined SOZ as well as the ALFF clusters (because of nearby eloquent cortex).
ALFF= amplitude of low-frequency fluctuations; s= second; SOZ= seizure onset zone; SEEG= Stereo-electroencephalography; MRI= magnetic resonance imaging; BOLD= Blood oxygenation level dependent.
