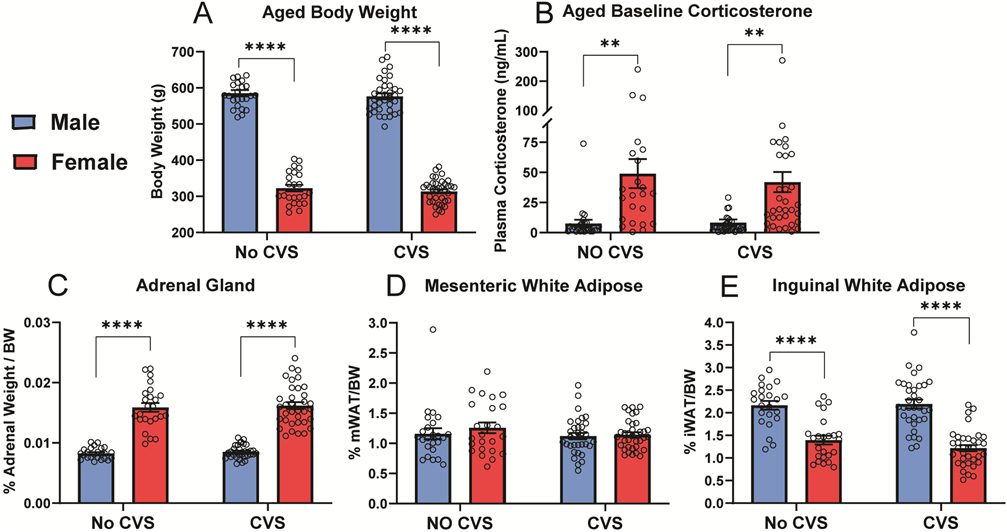
Figure 5: Aged baseline and somatic measures.
Following 13 months of aging, body weight (A) and baseline corticosterone (B) were measured. Following euthanasia, body weight-corrected weights of adrenal glands (C), mesenteric white adipose (D), and inguinal white adipose (E) were determined. No CVS: n = 24/sex and CVS: n = 36/sex. Data are expressed as mean ± SEM. * represents sex differences within stress condition. ** p < 0.01 and **** p < 0.0001.

