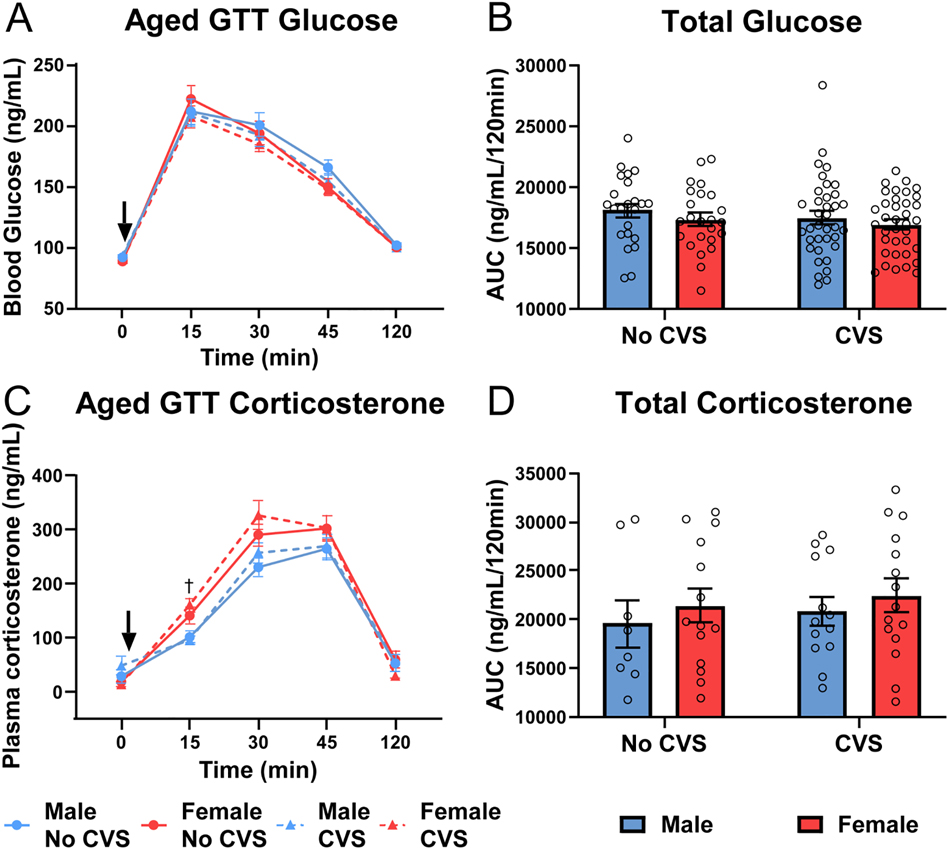
Figure 7: Aged GTT.
Baseline blood samples (0 min) were taken before glucose injection (1.5 g/kg, i.p.). Blood was taken at 15, 30, 45, and 120 min post injection in No CVS (n = 24/sex) and CVS (n = 36/sex) rats. At each time point, blood glucose was measured (A) and total blood glucose was calculated from the AUC (B). Plasma corticosterone was also measured (C) and cumulative corticosterone determined from the AUC (D). Data are expressed as mean ± SEM. ↓ represents glucose bolus, † represents sex difference within CVS (p < 0.05).

