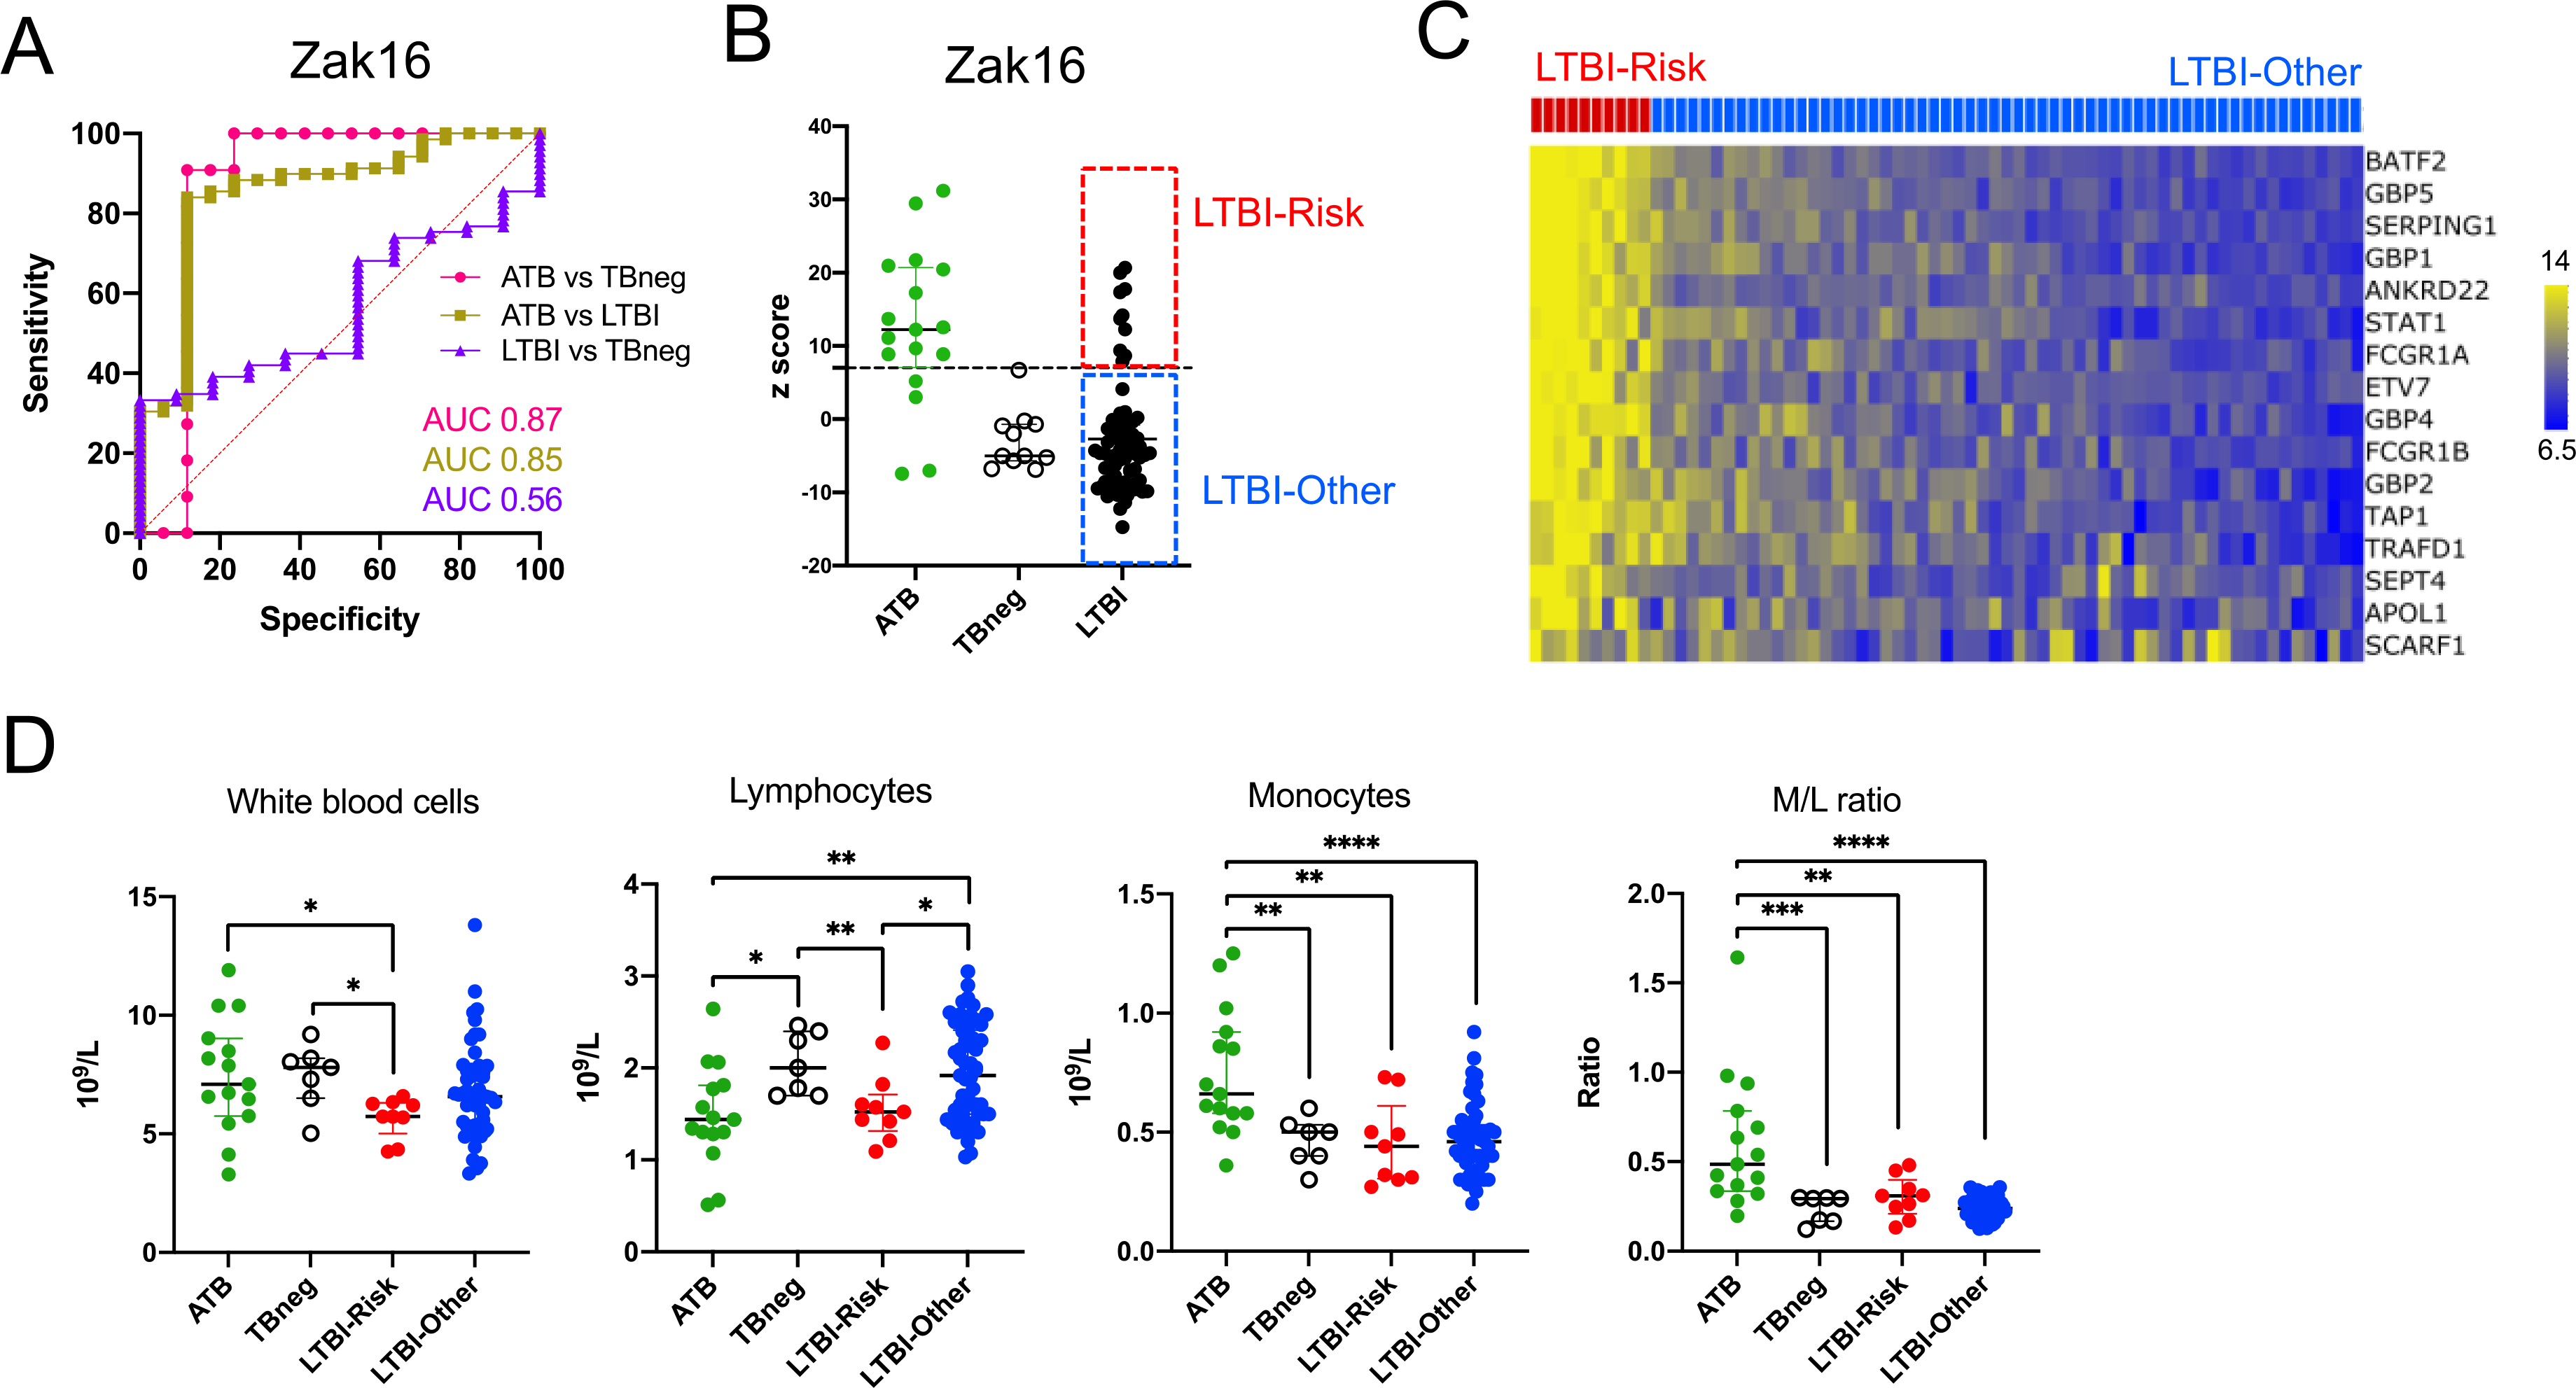
Figure 1: Identification of LTBI participants at higher risk progression based on the expression of a previously published ‘risk of progression to ATB’ signature prior the start of treatment.

A) Receiver operating characteristic (ROC) curves and B) individual z-scores for the Zak16 gene signature 17 in blood samples collected prior to treatment in ATB (n=17), LTBI (n=69) and TBneg (n=11) individuals. The upper value in the TBneg cohort was used to stratify the LTBI cohort into LTBI-Risk (n=10), and LTBI-Other (n=59) groups. C) Heatmap representing the normalized expression of individuals genes of the Zak16 gene signature in blood samples collected prior to treatment in LTBI-Risk and LTBI-Other individuals. If a gene was mapped to several probes, average expression of all probes was shown. D) Differences in full blood counts parameters in blood samples collected prior to treatment in ATB (n=15), TBneg (n=7), LTBI-Risk (n=9) and LTBI-Other (n=55). Statistical differences between cohorts were defined with the non-parametric unpaired Mann-Whitney test (* p < 0.05; ** p < 0.01; *** p < 0.001).
