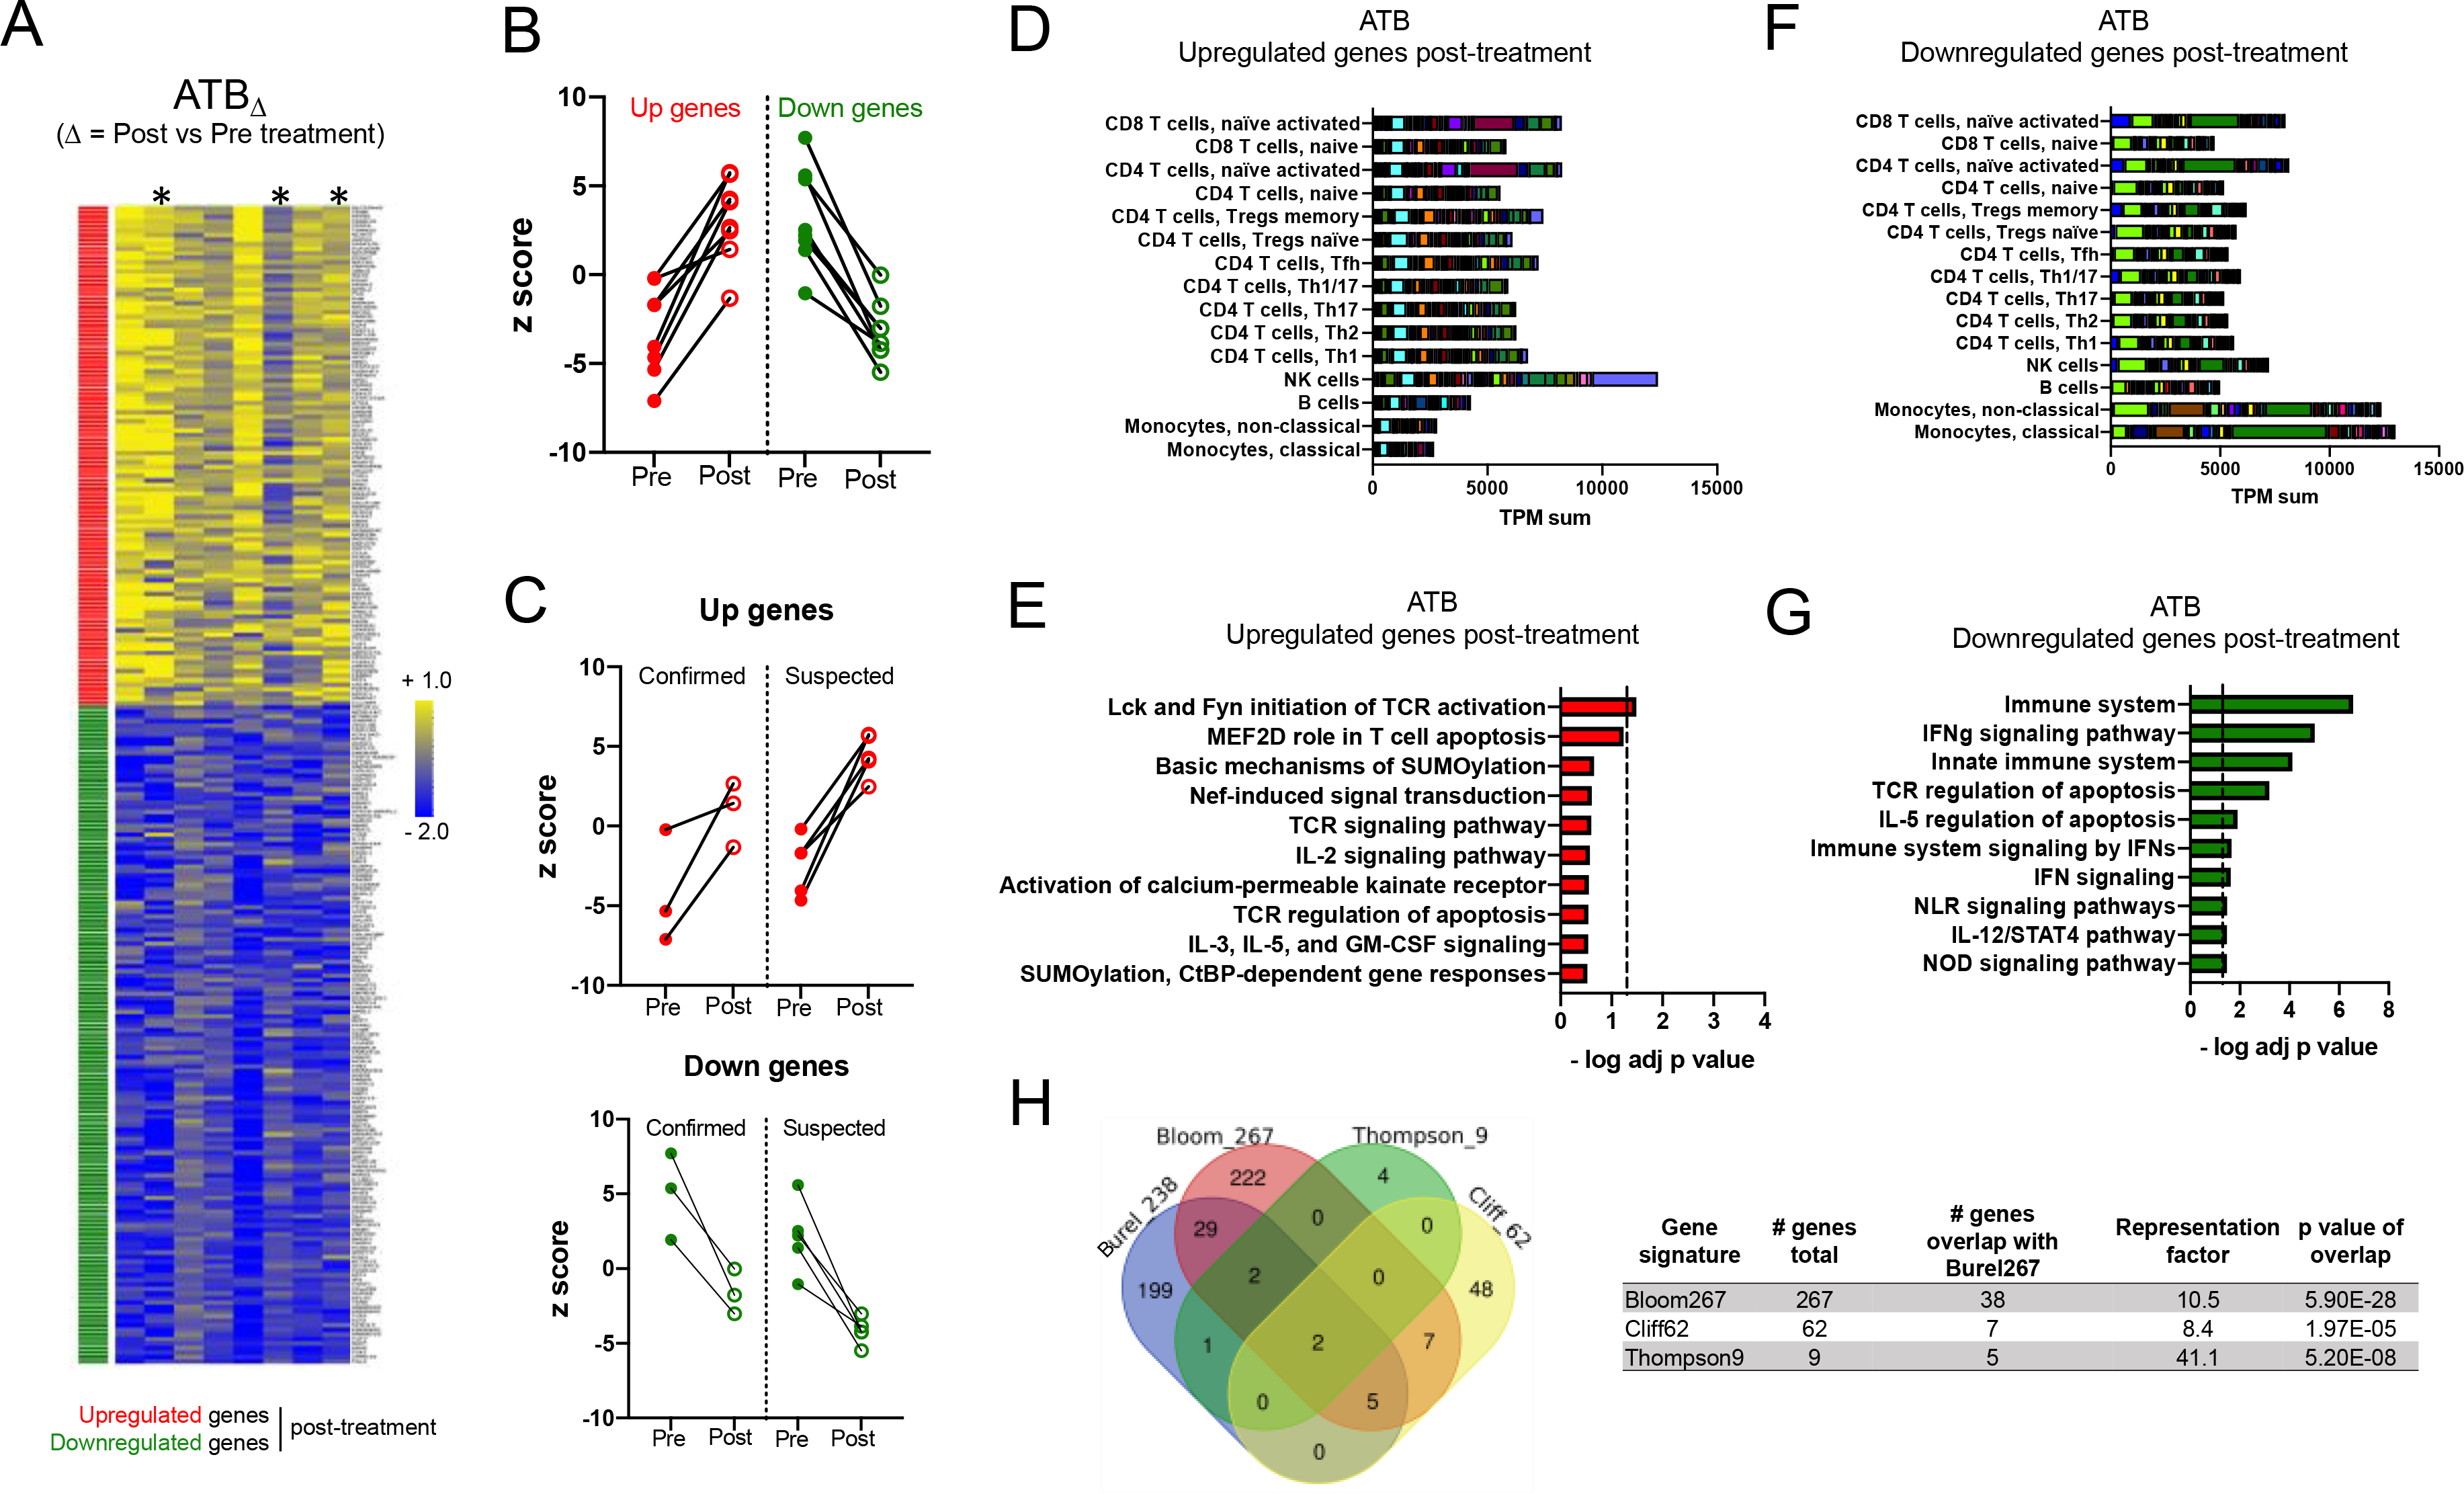
Figure 2: Blood transcriptomic signature of treatment in the ATB cohort is associated with NK cells, monocytes and IFN signaling.

A) Heatmap representing the log fold change expression upon treatment of the upregulated (red) and downregulated (green) gene-mapped probes in the ATBΔ signature derived from differential expression analysis (adjusted p value < 0.1) between post-and pre-treatment paired blood samples in the ATB cohort (n=8) (Table S3). Asterisks show microbiologically confirmed cases. B) Individual z-scores pre and post treatment for the upregulated and downregulated genes in the ATBΔ signature in B) all ATB participants (n=8) and C) microbiologically confirmed (n=3) vs suspected (n=5) ATB participants. D) Immune cell type-specific expression and E) top-10 biological pathways enriched in the upregulated genes of the ATBΔ signature. F) Immune cell type-specific expression and G) top-10 biological pathways enriched in the downregulated genes of the ATBΔ signature. (D,F) For immune cell type-specific expression, each bar consists of stacked sub-bars showing the TPM normalized expression of every gene in corresponding cell type, extracted from the DICE database 34 (http://dice-database.org/). (E,G) Biological pathways were ranked with increasing adjusted p value and dotted line represents significance threshold (adjusted p value < 0.05). H) Overlap between our newly identified ATBΔ treatment signature (Burel238) and previously reported signatures associated with anti-TB therapy 23, 24, 26.
