
Figure 3: Blood transcriptomic signature of treatment in the LTBI-Risk cohort is associated with activated T cells and IFN signaling.
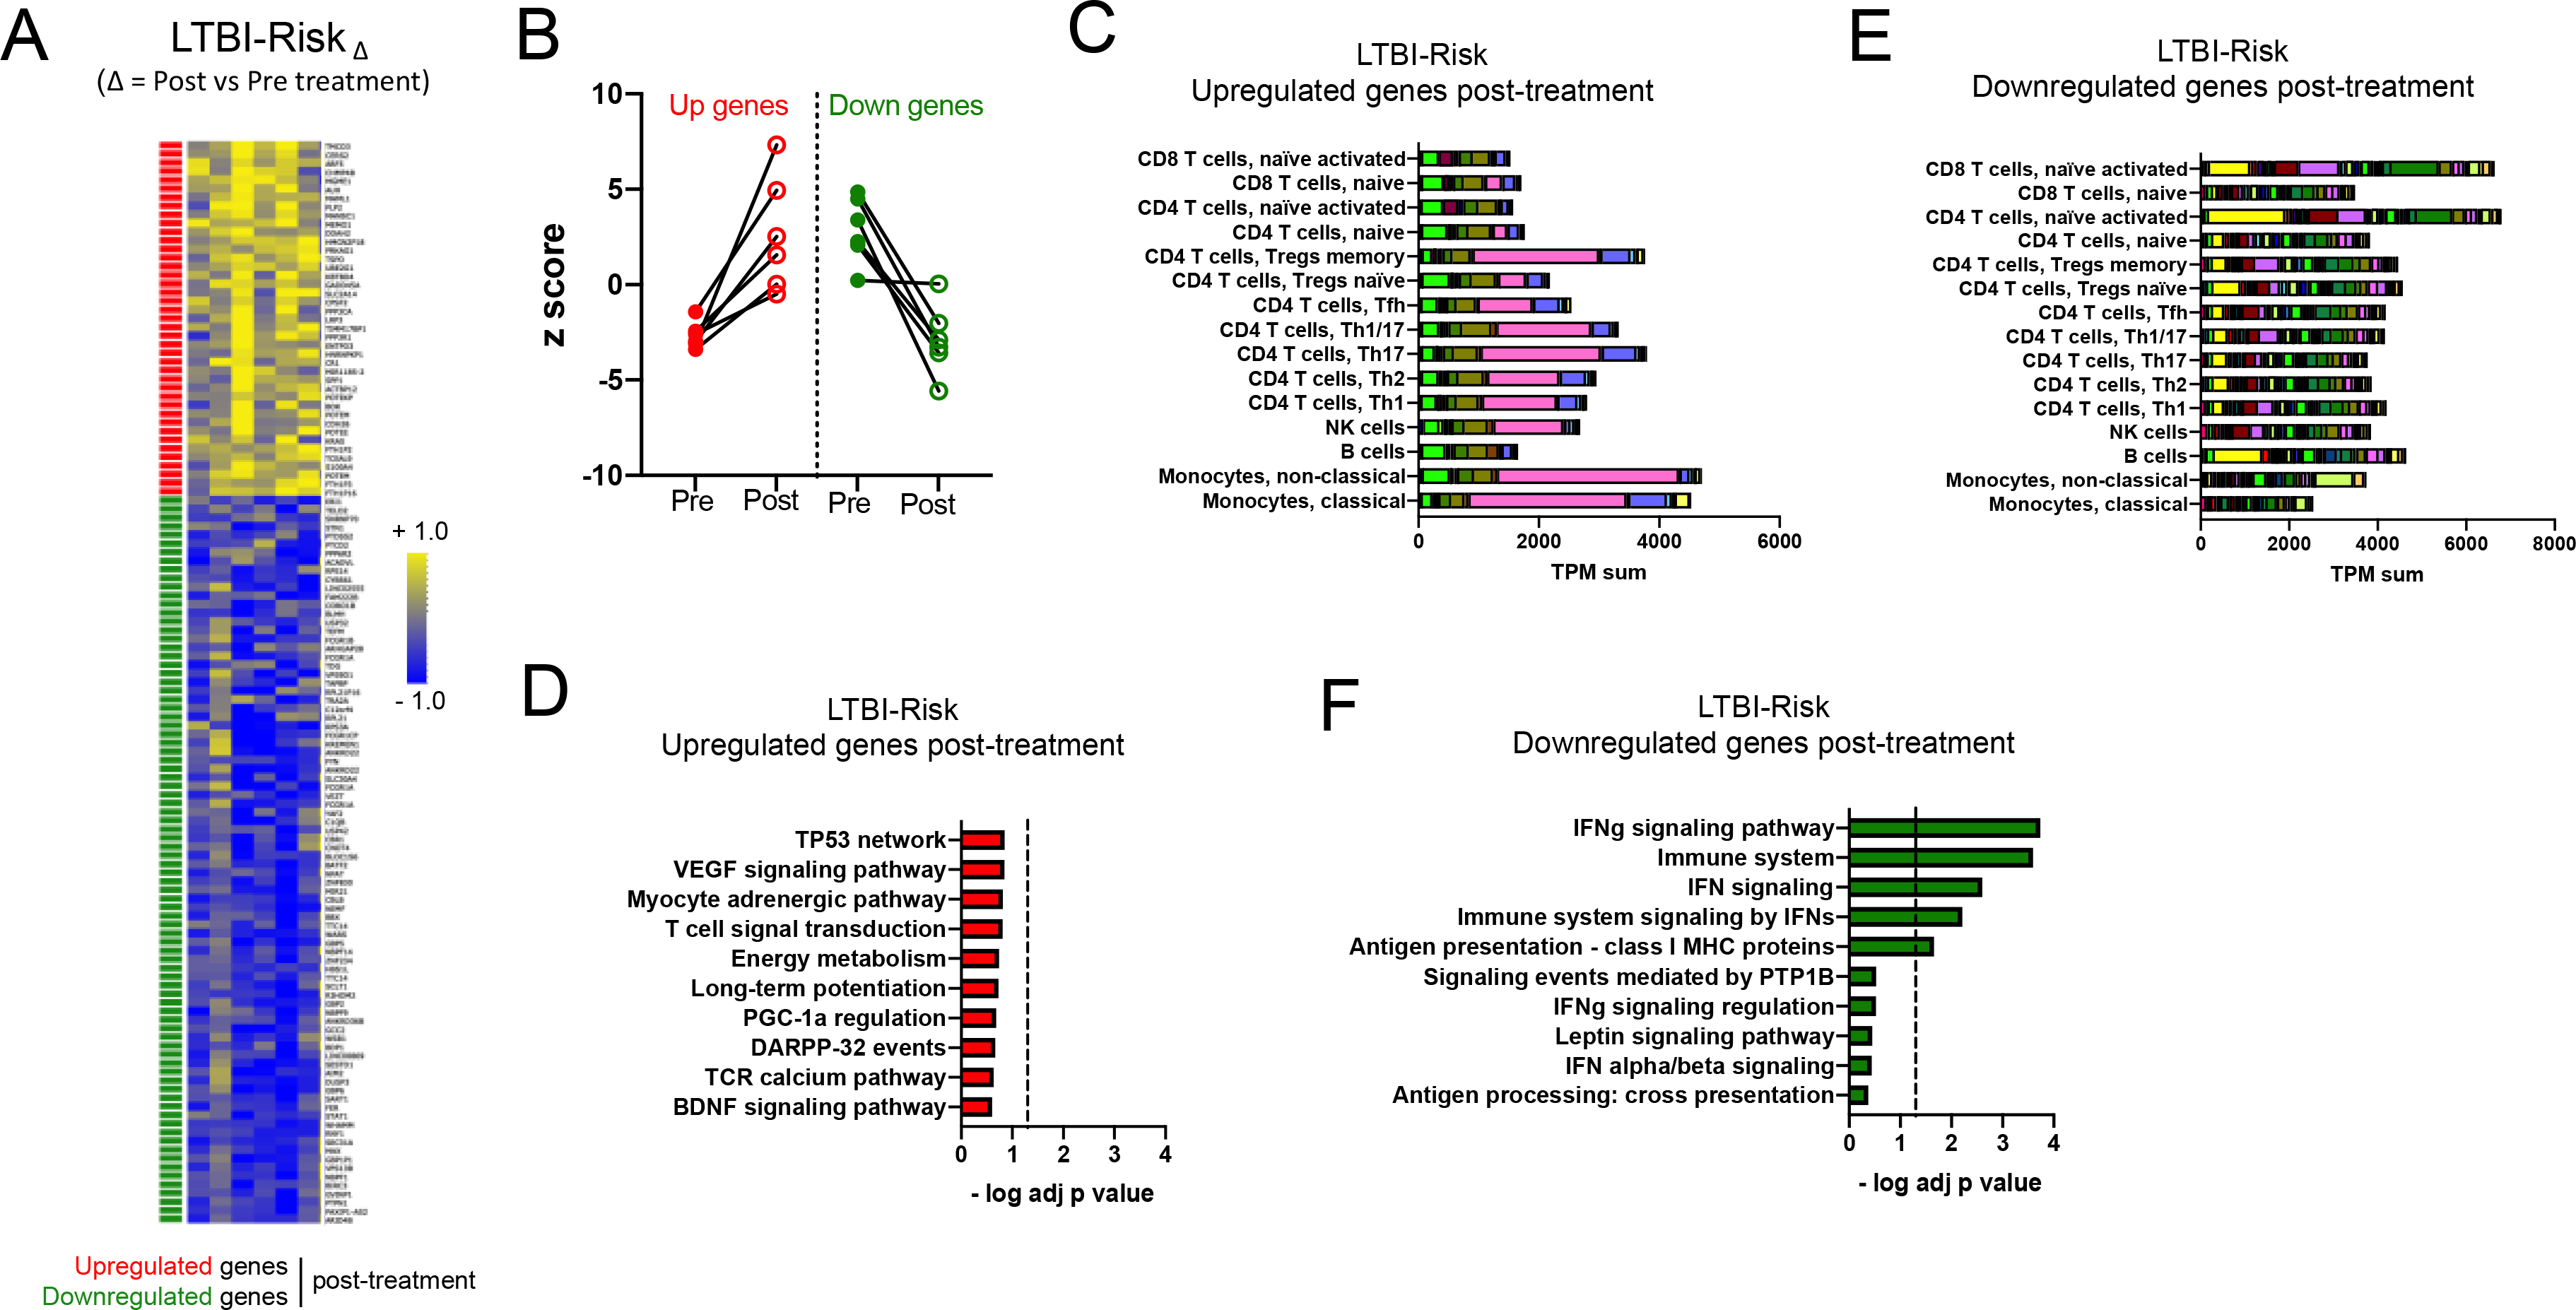
A) Heatmap representing the log fold change expression upon treatment and B) individual z-scores pre and post treatment for the upregulated (red) and downregulated (green) gene-mapped probes in the LTBI-RiskΔ signature derived from differential expression analysis (non-adjusted p value < 0.01, absolute log fold change > 0.2) between post-and pre-treatment paired blood samples in the LTBI-Risk cohort (n=6) (Table S5). C) Immune cell type-specific expression and D) top-10 biological pathways enriched in the upregulated genes of the LTBI-RiskΔ signature. E) Immune cell type-specific expression and F) top-10 biological pathways enriched in the downregulated genes of the LTBI-RiskΔ signature. (C,E) For immune cell type-specific expression, each bar consists of stacked sub-bars showing the TPM normalized expression of every gene in corresponding cell type, extracted from the DICE database 34 (http://dice-database.org/). (D,F) Biological pathways were ranked with increasing adjusted p value and dotted line represents significance threshold (adjusted p value < 0.05).