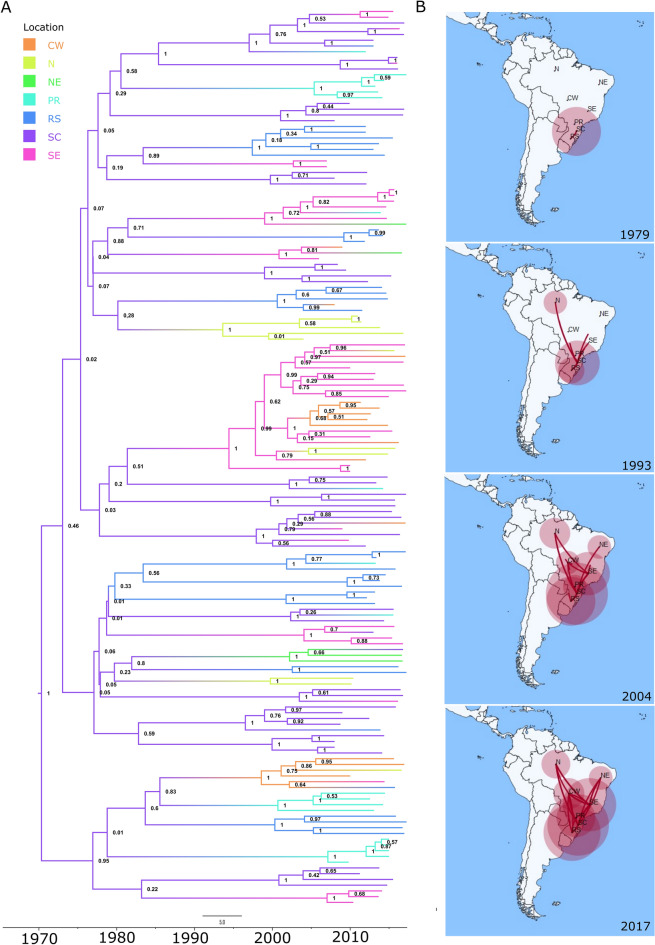
Figure 4.
Phylogeographic analysis of the evolution of HIV-1 subtype C transmission clusters. (A) Bayesian MCC time scaled discrete phylogeographic tree built using BEAST v1.10.4 of the HIV-1 subtype C sequences included in the transmission clusters that were sampled in Brazil and have complete information (n = 156). Tip location was defined as Brazilian region or state of sample collection. (B) Geographical representation of this transmission history. Acronyms and number of sequencies per location: N (North region of Brazil, n = 11), NE (North-East region of Brazil, n = 4), CW (Central-West region of Brazil, n = 14), SE (South-East region of Brazil, n = 34), SC (state of Santa Catarina in the South region of Brazil, n = 43), RS (state of Rio Grande do Sul in the South region of Brazil, n = 31), and PR (state of Paraná in the South region of Brazil, n = 19). SpreaD3 v0.9.6 (https://rega.kuleuven.be/cev/ecv/software/SpreaD3) was used to visualize the phylodynamic reconstruction resulting from Bayesian inference.

