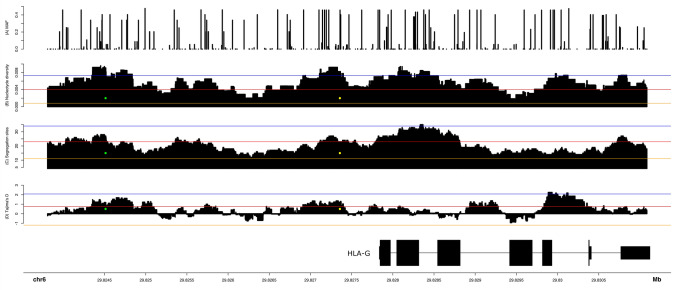
Figure 2.
Frequency of each variant (panel A), nucleotide diversity (panel B), number of segregation sites (panel C), and Tajima’s D (panel D) across HLA-G, considering all samples from the 1000Genomes project pooled together, starting from approximately 4 kb upstream the gene (the promoter region) to 100 nucleotides downstream HLA-G. Panels B, C, and D were computed in sliding windows of 500 nucleotides and a step size of 1. The HLA-G exon/intron structure is indicated in the bottom panel, with fine lines indicating introns and thick lines indicating exons. To evaluate the significance of the parameters estimated from HLA-G, we built a null distribution considering the patterns observed in chromosome 6, computing these statistics in 10,000 random windows of 500 nucleotides from chromosome 6. The values above the blue and red horizontal lines are higher than 99.9% and 99% of the ones observed for chromosome 6, respectively. The orange line represents the average observed in chromosome 6 for each statistic. The green and the yellow dots represent polymorphisms -3614 (rs1611163) and − 725 (rs1233334), respectively.

