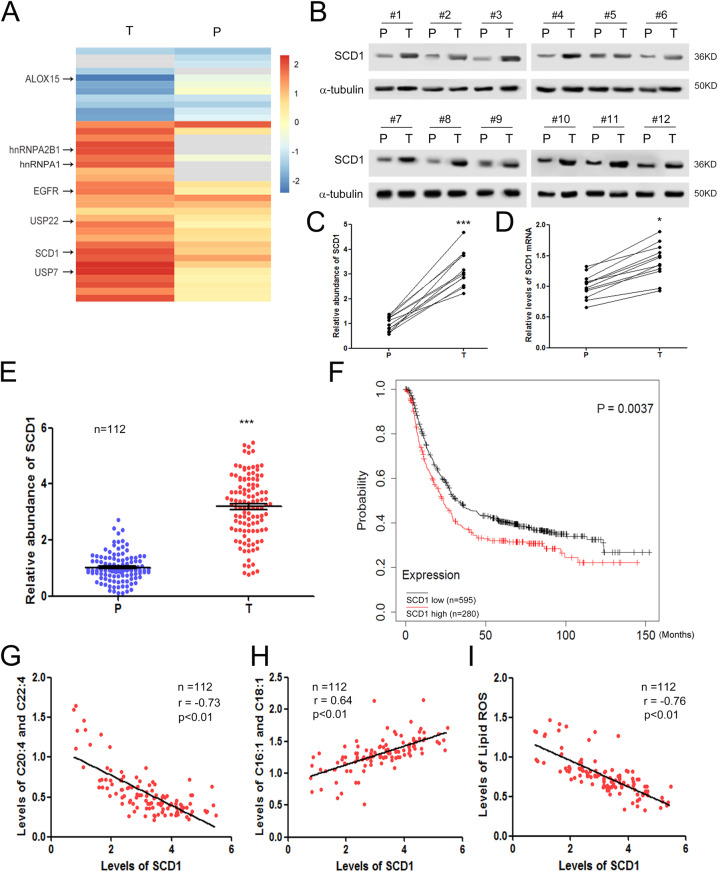
Fig. 1. SCD1 is related to lipid metabolism and ferroptosis in gastric cancer.
A Mass spectrum analysis of protein expression changes in gastric tumor tissues (n = 45). The heatmap depicts the relative protein abundance in tumor tissues (T) and paired paracarcinoma tissues (P). B Validation of SCD1 dysregulation in GC by using western blotting analysis (n = 12). C Quantitative analysis of (B) (n = 12). D Relative levels of SCD1 mRNA in gastric tumor tissues (n = 12). E Validation of SCD1 dysregulation in GC tissues using protein microarray (n = 112). F High expression of SCD1 predicts poor overall survival in GC. Patients were divided into the SCD1 high group (n = 280) and SCD1 low group (n = 595) based on the average value of SCD1 mRNA levels. G SCD1 is negatively correlated with polyunsaturated fatty acids (PUFAs) (C20:4 and C22:4) (n = 112). H SCD1 is positively correlated with monounsaturated fatty acids (MUFAs) (C16:1 and C18:1) (n = 112). I SCD1 is negatively correlated with lipid ROS production (n = 112). *p < 0.05 and ***p < 0.001.

