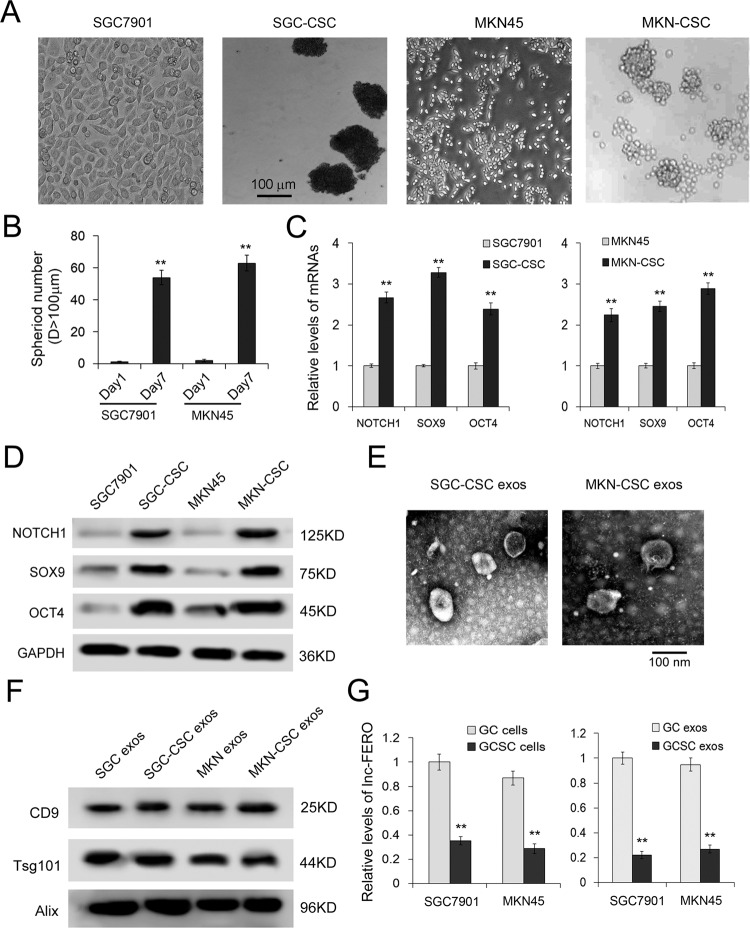
Fig. 3. The different expression characters of lncFERO in GC cells and GC stem cells.
A Sphere-formation assays were performed in indicated cell lines. B Number of tumorspheres (n = 3). C qRT-PCR analysis of stemness-associated genes, including NOTCH1, SOX9, and OCT4, in GC and GCSC cell lines (n = 3). D Detection of stemness-associated genes by western blotting assay (n = 3). E Exosomes images obtained from GCSCs were observed by using an electron microscope (scale bar, 100 nm). F Detection of exosome markers, CD9, Tsg101, and Alix, by western blotting assay. G Relative levels of lncFERO in GC cells and GCSCs (n = 3). **p < 0.01.

