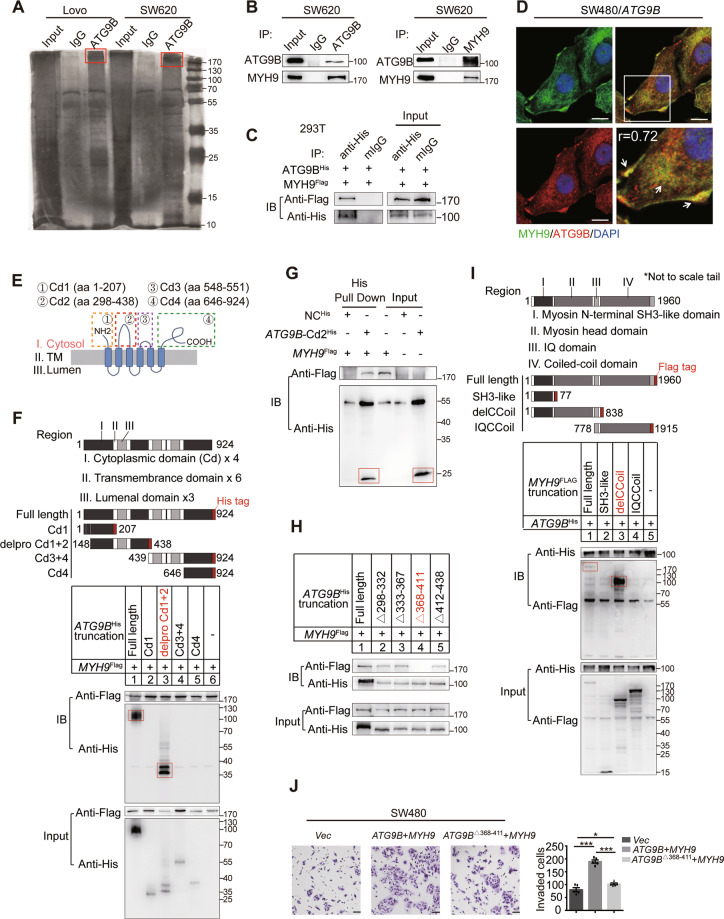
Fig. 3. MYH9 interacts with ATG9B directly.
A LoVo and SW620 cells were lysed and subjected to immunoprecipitation with anti-ATG9B antibody or rabbit IgG using silver staining. The red boxes represents the detected bands. B Endogenous ATG9B and MYH9 were immunoprecipitated in SW620 cells. C Exogenous ATG9BHis and MYH9Flag were immunoprecipitated in 293T cells. D ATG9B colocalized with MYH9 in SW480/ATG9B cells. The magnified parts are displayed in the lower right panel and the arrows points to the colocalized sites (scale bar 10 μm, r (Person’s correlation coefficient) = 0.72). E Cytoplasmic segments of ATG9B, including aa1–207 (Cd1), aa298–438 (Cd2), aa548–551 (Cd3) and aa646–924 (Cd4). F Diagrammatic representation of ATG9B and its truncated forms. Based on sequence and structure analyses, region I (cytoplasmic domain), region II (transmembrane domain) and region III (luminal domain) are indicated. 293T cells were transfected with the indicated constructs subjected to immunoprecipitation with anti-Flag (against MYH9). Immunoblot analysis was performed with anti-Flag or anti-His (against ATG9B). The red boxes represents the pull-down bands. G Direct binding of MYH9Flag to ATG9B-Cd2His using His pulldown assay. The red boxes represents the pull-down bands. H Constructs with deleted mutations Δ298-332, Δ333-367, Δ368-411 and Δ412-438 of ATG9B-Cd2His were used for immunoprecipitation with MYH9Flag. I Diagrammatic representation of MYH9 and its truncated forms. 293T cells were transfected with the indicated constructs subjected to immunoprecipitation with anti-His (against ATG9B). The red boxes represents the pull-down bands. J Transwell invasion assay detected SW480 cells transfected with vector, ATG9BHis together with MYH9Flag or ATG9BΔ368-411 together with MYH9Flag (scale bar 50 μm, n = 5). Data information: Graphs report mean ± SEM. Significance was assessed using two-tailed Student’s t test. ***P < 0.001, **P < 0.01, *P < 0.05.

