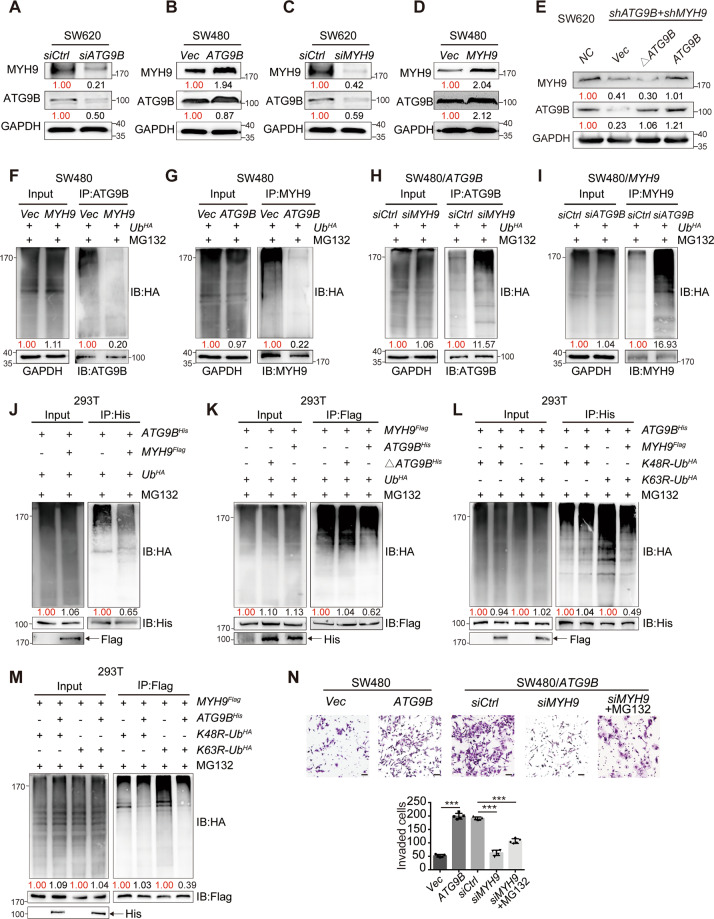
Fig. 4. ATG9B and MYH9 reciprocally reduce protein ubiquitination level.
A, B Western blot shows the MYH9 protein expression levels in SW620/siCtrl and SW620/siATG9B cells (A) or SW480/Vector and SW480/ATG9B cells (B). C, D Western blot shows the ATG9B protein expression levels in SW620/siCtrl and SW620/siMYH9 (C) or SW480/Vector and SW480/MYH9 cells (D). E Western blot shows the protein expression level of MYH9 in SW620/shATG9B + shMYH9 cells transfected with WT-ATG9B or ATG9BΔ368-411 plasmids. F Co-IP shows that HA-ubiquitin is pulled down by ATG9B in SW480/Vector or SW480/MYH9 cells. G Co-IP shows that HA-ubiquitin is pulled down by MYH9 in SW480/vector or SW480/ATG9B cells. H Co-IP shows that HA-ubiquitin is pulled down by endogenous ATG9B in SW480/ATG9B cells with control or MYH9 knockdown. I Co-IP shows that HA-ubiquitin is pulled down by endogenous MYH9 in SW480/MYH9 cells with control or ATG9B knockdown. J Co-IP analysis using 293T cells transfected with the indicated plasmids and treated with MG132. K Co-IP analysis using 293T cells transfected with plasmids encoding UbHA, MYH9Flag, or ATG9BHis, or ΔATG9BHis (deleted mutation with aa368–411 of ATG9B) and treated with MG132. L Co-IP analysis using 293T cells transfected with plasmids encoding ATG9BHis, together with MYH9Flag or HA-K48R-Ubiquitin (K48R-UbHA) and HA-K63R-Ubiquitin (K63R-UbHA) and treated with MG132 to detect His-ATG9B ubiquitination. M Co-IP analysis using 293T cells transfected with the indicated plasmids and treated with MG132 to detect Flag-MYH9 ubiquitination. N Transwell invasion assay detected SW480/Vector, SW480/ATG9B cells and SW480/ATG9B cells transfected with siRNA-control (siCtrl), siMYH9 or siMYH9 treated with MG132. Quantification of invaded cells are shown in the right panel (scale bar 50 μm, n = 5). Data information: Graphs report mean ± SEM, n = 3. Quantification of average protein levels or ubiquitination levels were normalized to those of GAPDH or IB protein listed under the bands, and each Control/Vector group was normalized as 1.00 marked in red, and the value of the experimental group was compared with it marked in black. Significance was assessed using two-tailed Student’s t test. ***P < 0.001.

