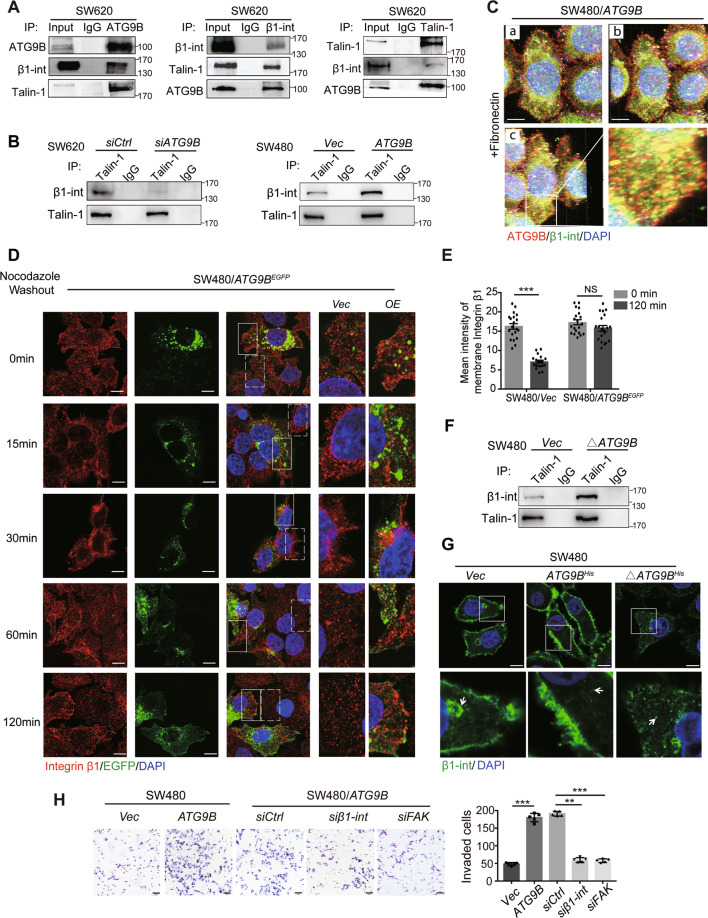
Fig. 7. ATG9B participates in FA formation through mediating integrin β1 activation and polarization.
A Co-IP assays were applied to detect the immunoprecipitation of ATG9B, integrin β1 and Talin-1 in SW620 cells. B The immunoprecipitation of Talin-1 and integrin β1 was detected in SW620 cells transfected with si-Control or si-ATG9B (left panel) and in SW480 cells transfected with vector or ATG9B plasmids (right panel). C Three-dimensional shooting presented the colocalization of ATG9B and integrin β1 in fibronectin-coated dishes. a Frontage shooting (0°). b Shooting of rotating 45° to the right. c Shooting of rotating 225° to the right. The magnified parts are displayed in the lower right panel, scale bar 10 μm. D Immunofluorescence images of integrin β1 in SW480/ATG9BEGFP cells after treatment with 10 μM nocodazole (NZ) for 4 h followed by washout for the indicated times, scale bar 10 μm. The magnified parts of vector cells (dotted line) and ATG9BEGFP overexpression cells (solid line) were respectively displayed in the right panel. E Mean intensity levels of surface integrin β1 at the indicated times of NZ washout is presented in the right panel (n = 20 cells analysed per group). F The immunoprecipitation of Talin-1 and integrin β1 was detected in SW480 cells transfected with vector and ΔATG9B (deleted mutation with aa368–411 of ATG9B) plasmids. G The distribution of integrin β1 detected by IF staining in the indicated cells. The magnified parts are displayed in the lower panel, scale bar 10 μm. The arrows represents the intracellular localization. H Transwell invasion assay was used to analyse the invasive ability of the indicated cells. Quantification of invaded cells are shown in the right panel (scale bar 50 μm, n = 5). Data information: Graphs report mean ± SEM. Significance was assessed using two-tailed Student’s t test. ***P < 0.001, **P < 0.01, NS, no significance.

