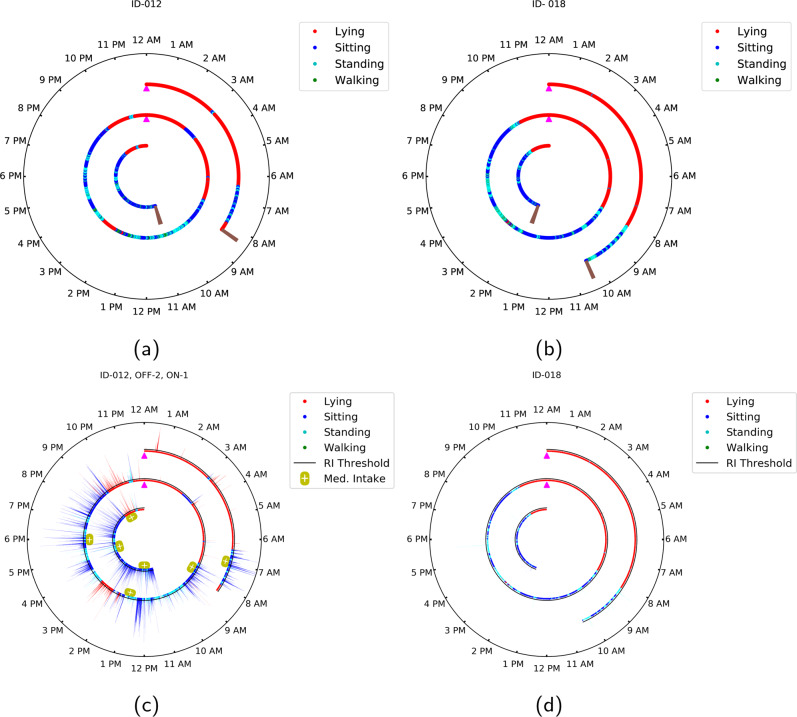
Fig. 1. Clock visualization of activity and tremor for a PD and a control participant.
A 24-h clock format visualization for a activity for a participant with PD and b activity for a control participant, c activity, tremor, and medication for a participant with PD, and d activity and (lack of) tremor for a control participant. Data over the duration of sensor wear is depicted in the polar plots, with the brown marker in the innermost and the outermost circle representing the start and end of the sensor wear duration, respectively. The concentric circles each represent different days and the magenta markers (located at 12 AM position) indicate the transition from one calendar day to the next. The activity is classified into one of four classes (lying, sitting, standing, and walking) for each 2-second interval and represented as a corresponding color-coded dot in the polar plot. Each color-coded bar on the polar plots in (c) and (d) jointly represent the rhythmicity index and activity state over a 2-s interval, with the color identifying the activity state and the height of the bar indicating the rhythmicity index (tremor amplitude). The black circle above each radius represents the rhythmicity index threshold, which is set to a value of 3.3. The yellow capsule-shaped markers below each radius represent the medication intake timings for the participants with PD.

