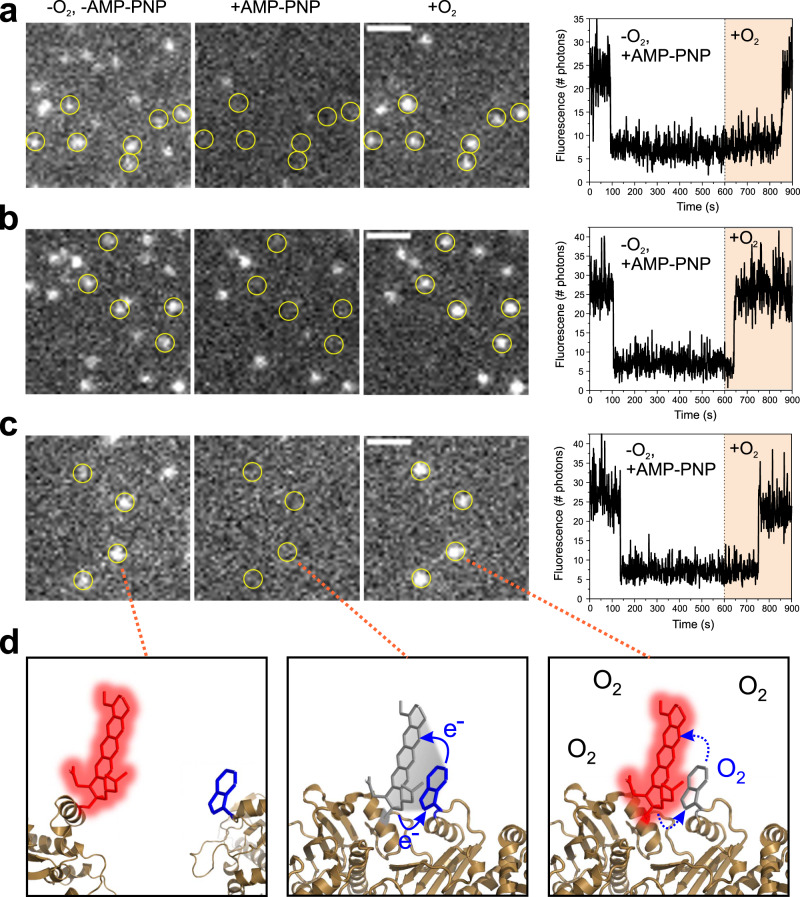
Fig. 2. One-colour smPET fluorescence microscopy of Hsp90 dynamics.
TIRF images of single, immobilized Hsp90 molecules modified with AttoOxa11 PET fluorescence reporters for a DS, b Lid and c NM-association. White bars are 2-µm scale bars. For each reporter a time series of images is shown recorded in (i) oxygen-depleted solution before addition of AMP-PNP (-O2, -AMP-PNP), (ii) oxygen-depleted solution after addition of AMP-PNP (+AMP-PNP), and (iii) after application of oxygen-rich solution following the addition of AMP-PNP (+O2). The respective conditions are indicated on top of panel a. Hsp90 molecules identified to undergo PET fluorescence quenching through subsequent fluorescence recovery by DSPO are highlighted by yellow circles. Panels on the right hand side show representative fluorescence intensity time traces of individual Hsp90 molecules that undergo PET fluorescence quenching followed by fluorescence recovery through DSPO. AMP-PNP was applied at t = 0 s. Oxygen-rich solution was applied at t = 600 s. Experiments were repeated three times with similar results. Source data are provided as a Source Data file. d Functional principle of a PET fluorescence reporter on Hsp90 (illustrated for NM-association in a series of molecular graphics images). Conformational change results in contact between fluorophore (red sticks) and Trp (blue sticks). Fluorescence of the label is quenched through PET in oxygen-depleted solution (solid blue arrows). DSPO of Trp by molecular oxygen annihilates PET (broken blue arrows) and recovers fluorescence of the label.

