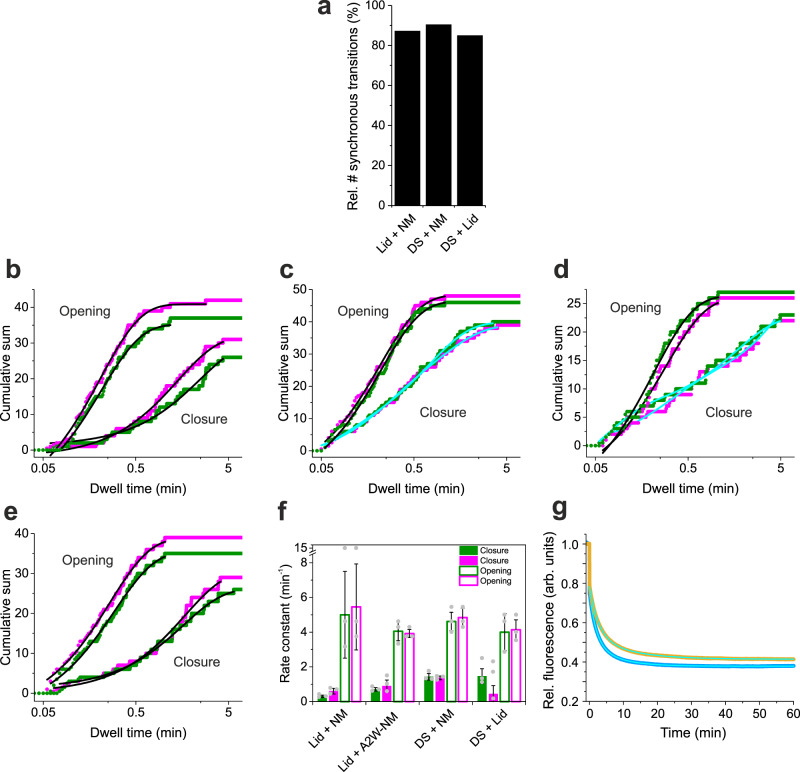
Fig. 5. Cooperativity and kinetics of conformational cycling of Hsp90.
a Relative number of synchronous transitions detected from two-colour smPET fluorescence intensity time traces recorded from pairwise reporters for Lid, DS and NM-association. b–e Cumulative sum plots of dwell times in fluorescent states (kinetics of closure) and in fluorescence-quenched states (kinetics of opening) determined from the reporter pairs LidAtto542-NMJF646 (b), DSAtto542-NMJF646 (c), DSAtto542-LidJF646 (d) and LidAtto542-A2W-NMJF646 (e). Data shown in green and magenta are from fluorescence of Atto542 and JF646, respectively. Black lines are mono-exponential fits to the data. Cyan lines are bi-exponential fits to the data. f Mean rate constants of closure (closed bars) and opening (open bars) determined from fits to the data shown in b–e. Values are the mean of three measurements and errors are standard deviations (n = 3; ±s.d.). g Bulk fluorescence measurements of kinetics of NM-association of Hsp90 probed by a one-colour PET reporter involving JF646 as a probe (orange). Data from the same construct but containing mutation A2W on the opposite subunit are shown in blue. Measurements were carried out on a benchtop fluorimeter. 4 mM AMP-PNP was added at t = 0 min. Cyan lines are bi-exponential fits to the data. Source data are provided as a Source Data file.

