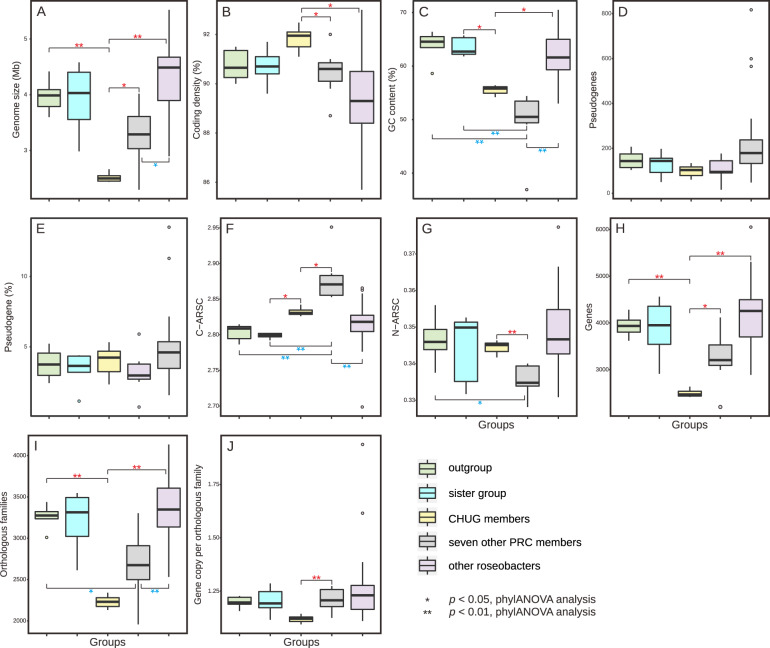
Fig. 2. Genomic feature comparisons between CHUG, their sister group, the outgroup, seven other PRC members, and other reference roseobacters.
The significance level in genomic features between CHUG and the other four groups is shown in red, while that between seven other PRC members and the remaining groups are shown in blue. Statistical tests were performed using phylANOVA analysis [26] for genome size (A), coding density (B), GC content (C), number of pseudogenes (D), ratio of pseudogenes (E), C-ARSC (F), N-ARSC (G), number of genes (H), number of orthologous families (I), and gene copy number per orthologous family (J), respectively. The markers *p < 0.05 and **p < 0.01, respectively. C-ARSC carbon atoms per amino-acid-residue side chain, N-ARSC nitrogen atoms per amino-acid-residue side chain.

