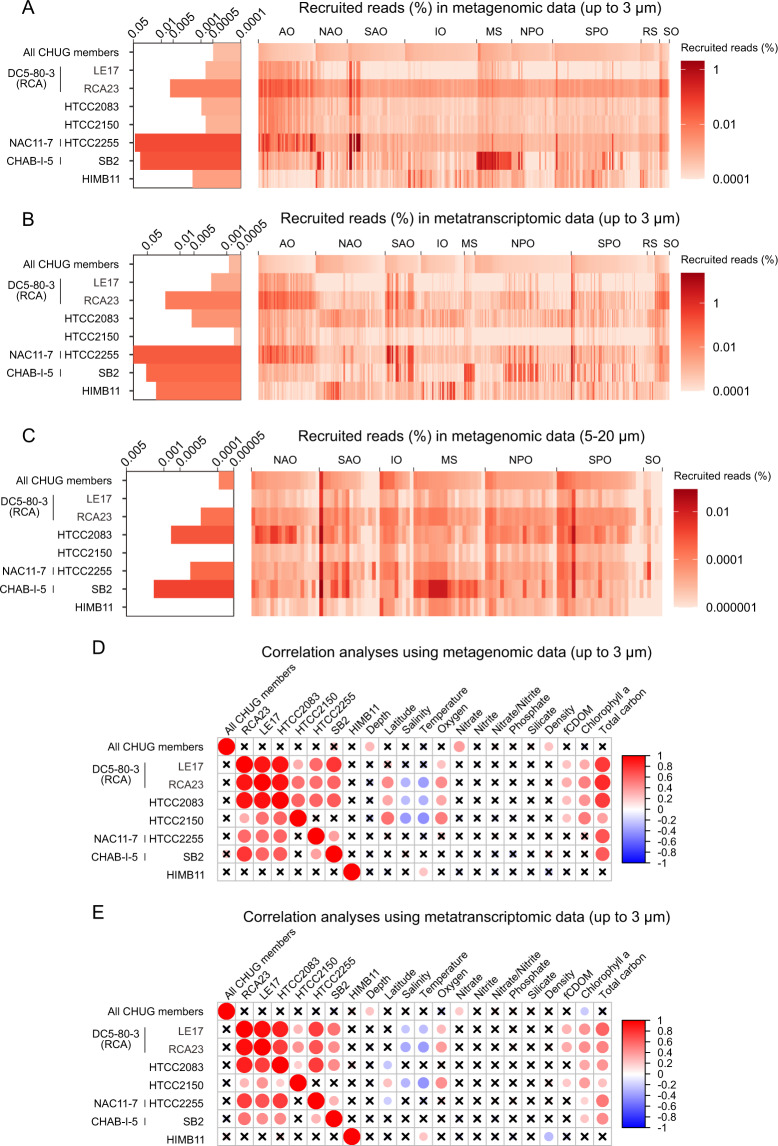
Fig. 3. The global distribution of CHUG and its ecological correlation with environmental factors.
A–C The relative abundance of CHUG and other PRC members in the bacterial communities based on recruitment analysis using the metagenomic TARA Ocean sequencing samples with size fractions up to 3 µm (A), and metatranscriptomic sequencing samples with size fractions up to 3 µm (B), and metagenomic sequencing samples with size fraction of 5–20 µm (C). D, E Correlation analysis between the relative abundance of CHUG and other PRC members and environmental parameters measured in the TARA Ocean metagenomic (D) and metatranscriptomic (E) samples. The p value is adjusted using stringent Bonferroni correction. Nonsignificant correlations are indicated by crosses for p > 0.05 after adjusting. AO Arctic Ocean, NAO North Atlantic Ocean, SAO South Atlantic Ocean, IO Indian Ocean, MS Mediterranean Sea, NPO North Pacific Ocean, SPO South Pacific Ocean, RS Red Sea, SO Southern Ocean, fCDOM fluorescence, colored dissolved organic matter.

