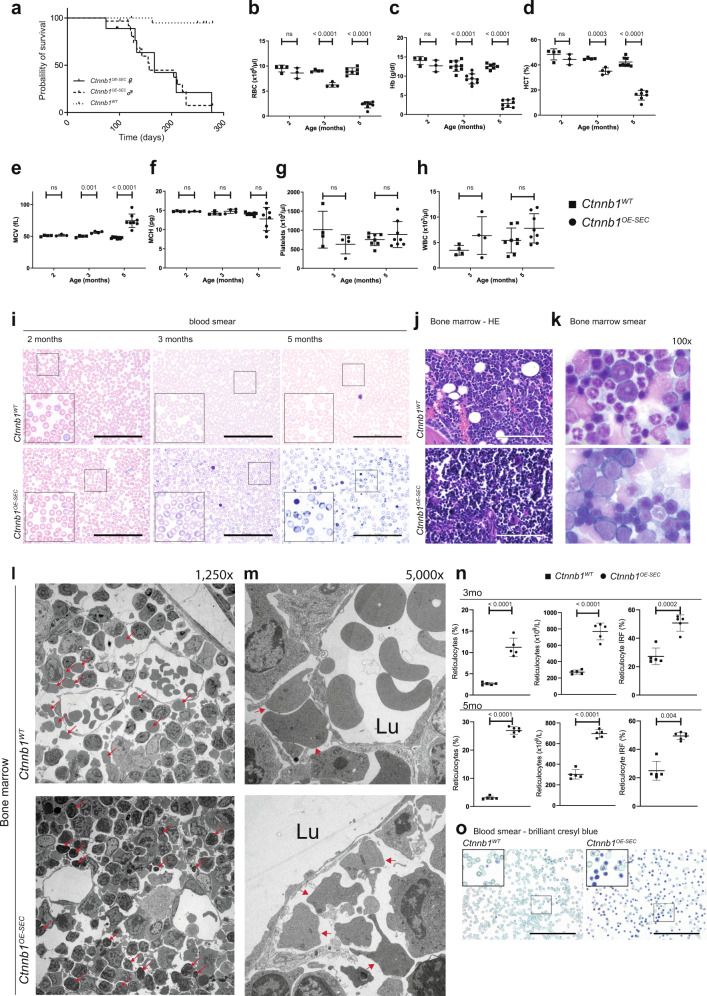
Fig. 2. Activation of β-catenin in BM-SECs (Ctnnb1OE-SEC) causes fatal anemia.
a Kaplan–Meier survival curves for control (Ctnnb1WT) and Ctnnb1OE-SEC mice. The probability of survival is shown for Ctnnb1OE-SEC female (n = 18) vs. Ctnnb1OE-SEC male (n = 30) vs. Ctnnb1WT mice (n = 25). b–f Red blood cell indices for 2-, 3-, and 5-month-old male Ctnnb1WT and Ctnnb1OE-SEC mice. b Red blood cells (RBC) (2 months, n ≥ 3; 3 months, n = 4; 5 months, n ≥ 7), c hemoglobin (Hb) (2 months, n ≥ 3; 3 months, n = 9; 5 months, n ≥ 7), d hematocrit (HCT) (2 months, n ≥ 3; 3 months, n = 4; 5 months, n ≥ 7), e mean corpuscular volume (MCV) (2 months, n ≥ 3; 3 months, n = 4; 5 months, n = 8), f mean corpuscular hemoglobin (MCH) (2 months, n ≥ 3; 3 months, n = 4; 5 months, n = 8). g Platelet (3 months, n = 4; 5 months, n = 8) and h white blood cell (WBC) counts (3 months, n = 4; 5 months, n = 8) for 3- and 5-month-old male Ctnnb1WT and Ctnnb1OE-SEC mice. i Peripheral blood smears of 2- and 3-month-old female and 5-month-old male Ctnnb1WT and Ctnnb1OE-SEC (n ≥ 3) mice. Scale bars: 100 μm. j H&E staining of bone marrow sections of 3-month-old female Ctnnb1WT and Ctnnb1OE-SEC (n = 5). Scale bar: 100 μm. k Bone marrow smears of 5-month-old male Ctnnb1WT and Ctnnb1OE-SEC (n = 3) mice (×100 enlargement). l, m Representative transmission electron microscopy analysis of Ctnnb1WT and Ctnnb1OE-SEC bone marrow. l Arrows indicate erythroblasts, reticulocytes in the bone marrow parenchyma (×1250 enlargement). m Arrows indicate reticulocytes outside of sinusoidal walls (×5000 enlargement). 3- and 4-month-old female Ctnnb1WT and Ctnnb1OE-SEC mice (n = 3). n, o Reticulocyte analysis in the peripheral blood. n Relative (%), absolute (×109/L) reticulocyte numbers, and immature reticulocyte fraction (IRF) in the peripheral blood of 3- and 5-month-old female Ctnnb1WT and Ctnnb1OE-SEC mice (n ≥ 5). o Brilliant cresyl blue staining of blood smears of 5-month-old male Ctnnb1WT and Ctnnb1OE-SEC mice (n = 3). Scale bar: 100 μm. The dots in the graphs represent individual mice. Mean ± s.e.m. is shown for each group of mice in all graphs. Statistical significance was determined using Student’s t-test or Mann–Whitney U test (two-sided). ns, not significant. Source data, precise values of n, and employed statistical tests for a, b, c, d, e, f, g, h, n are provided as a Source Data file.

