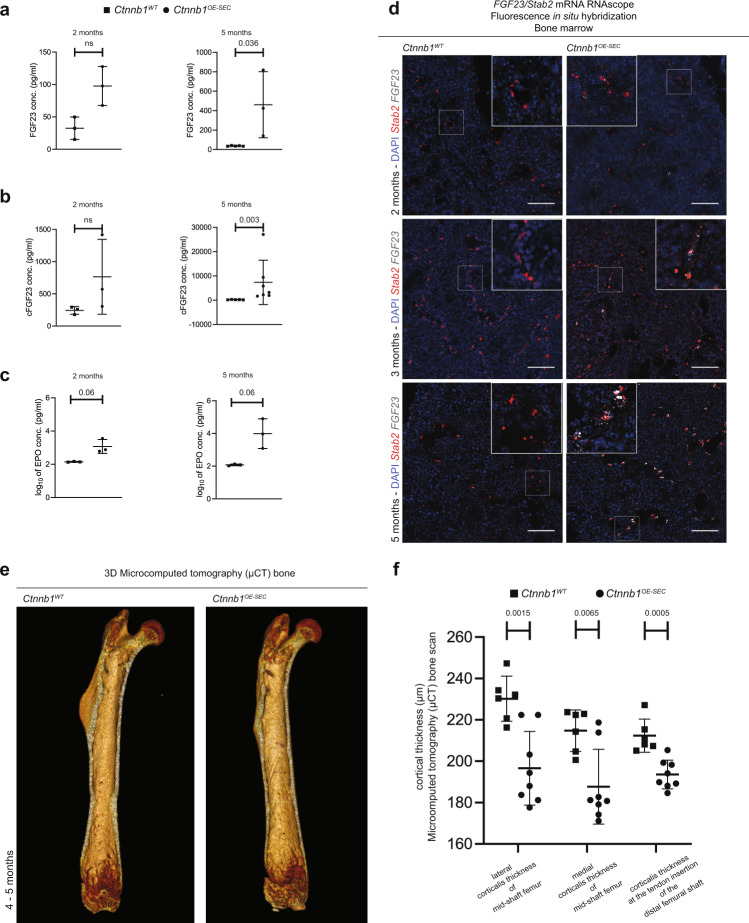
Fig. 5. Ctnnb1OE-SEC mice show de novo expression of FGF23 in BM-SECs and serum.
a Serum FGF23 (2-month-old mice, n = 3; 5-month-old mice, n ≥ 3), b cFGF23 (2-month-old mice, n = 3; 5-month-old mice, n ≥ 5), and c EPO levels (2- and 5-month-old mice, n = 3) of Ctnnb1WT and Ctnnb1OE-SEC mice measured by ELISA. The dots in the graphs represent individual female mice. d mRNA RNAScope® FISH assay with DAPI, FGF23 (white) and Stab2 (red) of Ctnnb1WT and Ctnnb1OE-SEC bone marrow (2-, 3-, and 5-month-old male mice, n ≥ 3). Scale bars: 50 μm. e, f Micro-computed tomography (μCT) bone scan of femurs (right and left limb) of 4- and 5-month-old female Ctnnb1WT (n = 6 from three mice) and Ctnnb1OE-SEC (n = 8 from four mice). e Exemplary view of the inside from a 3D reconstructed μCT scan of Ctnnb1WT and Ctnnb1OE-SEC femurs. f μCT quantification of corticalis thickness (μm) at selected femoral regions. The dots in the graphs represent measurements of the lower extremities (right and left limb) of individual mice. Mean ± s.e.m. is shown for each group of mice in all graphs. Statistical significance was determined using Student’s t-test or Mann–Whitney U test (two-sided). ns, not significant. Source data, precise values of n and employed statistical tests for a, b, c, f are provided as a Source Data file.

