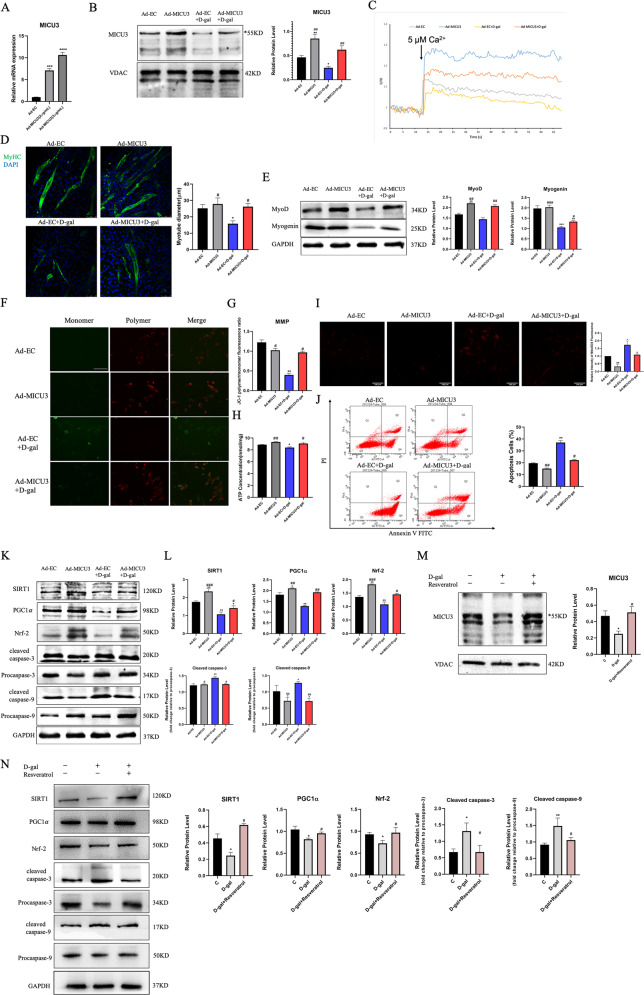
Fig. 5. MICU3 alleviated differentiation capacity impairment and mitochondrial dysfunction in D-gal-treated C2C12 cells.
A The mRNA level of MICU3 in C2C12 cells. B Western blot and quantification for MICU3 in C2C12 cells. VDAC was used as the loading control. *indicates target bands. C The mitochondrial calcium uptake assay in C2C12 cells. D The photo and quantification of myotubes (magnification = ×200; scale bar = 75 μm). E Western blot for MyoD and Myogenin. GAPDH was used as the loading control. F, G The JC-1 staining of C2C12 cells (scale bar = 100 μm). H The ATP concentration in C2C12 cells. I The fluorescence staining for MitoSOX (magnification = ×200; scale bar = 100 μm). J Representative pictures of flow cytometry analysis in Annexin V- FITC/PI staining. K, L Western blot for SIRT1, PGC1α, Nrf-2, cleaved caspase-3, cleaved caspase-9, Procaspase-3, and Procaspase-9. GAPDH was used as the loading control. Data were expressed as means ± SEM, and data were analyzed using one-way ANOVA and two-way ANOVA. *p < 0.05 vs. the Ad-EC group; #p < 0.05 vs. the Ad-EC + d-gal group; n = 3. M Western blot and quantification for MICU3 in C2C12 cells treated with d-gal and resveratrol. VDAC was used as the loading control. *indicates target bands. N Western blot for SIRT1, PGC1α, Nrf-2, cleaved caspase-3, cleaved caspase-9, Procaspase-3, and Procaspase-9. GAPDH was used as the loading control. Data were expressed as means ± SEM, and data were analyzed using one-way ANOVA. *p < 0.05 vs. The C (d-gal = 0 g/L) group; #p < 0.05 vs. the d-gal (d-gal = 20 g/L) group; n = 3.

