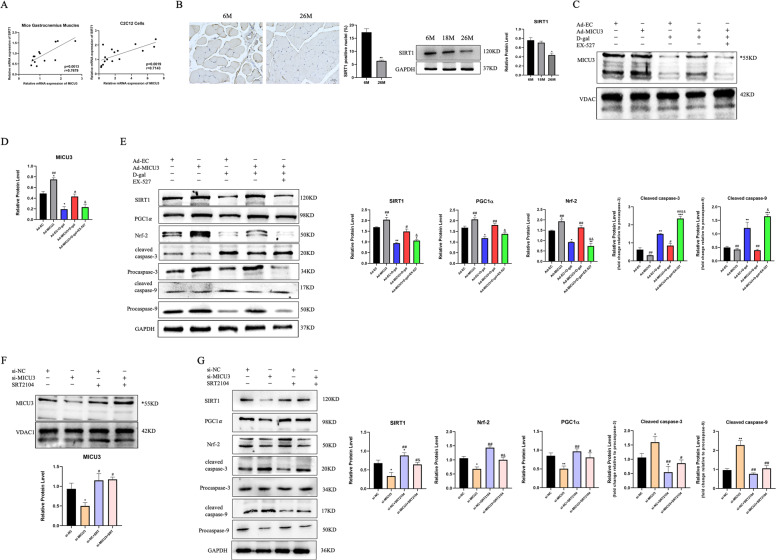
Fig. 7. SIRT1 plays a critical role in the effect of MICU3.
A Correlation graphs between the mRNA expression of MICU3 and SIRT1. B IHC and western blot for SIRT1 in mice from different age groups (magnification ×400; scale bar = 20 μm, *p < 0.05 vs. the 6M group; n = 3). C, D Western blot and quantification of MICU3. VDAC was used as the loading control. *indicates target bands. E Western blot and quantification of SIRT1, PGC1α, Nrf-2, cleaved caspase-3, cleaved caspase-9, Procaspase-3, and Procaspase-9. GAPDH was used as the loading control. (*p < 0.05 vs. the Ad-EC group; #p < 0.05 vs. the Ad-EC + d-gal group; &p < 0.05 vs. the Ad-MICU3 + d-gal group; n = 3). F Western blot and quantification of MICU3. VDAC was used as the loading control. *indicates target bands. G Western blot and quantification of SIRT1, PGC1α, Nrf-2, cleaved caspase-3, cleaved caspase-9, Procaspase-3, and Procaspase-9. GAPDH was used as the loading control. (*p < 0.05 vs. the si-NC group; #p < 0.05 vs. the si- MICU3 group; &p < 0.05 vs. the si-NC + SRT2104 group; n = 3). Data were expressed as means ± SEM, and data were analyzed using a one-way ANOVA.

