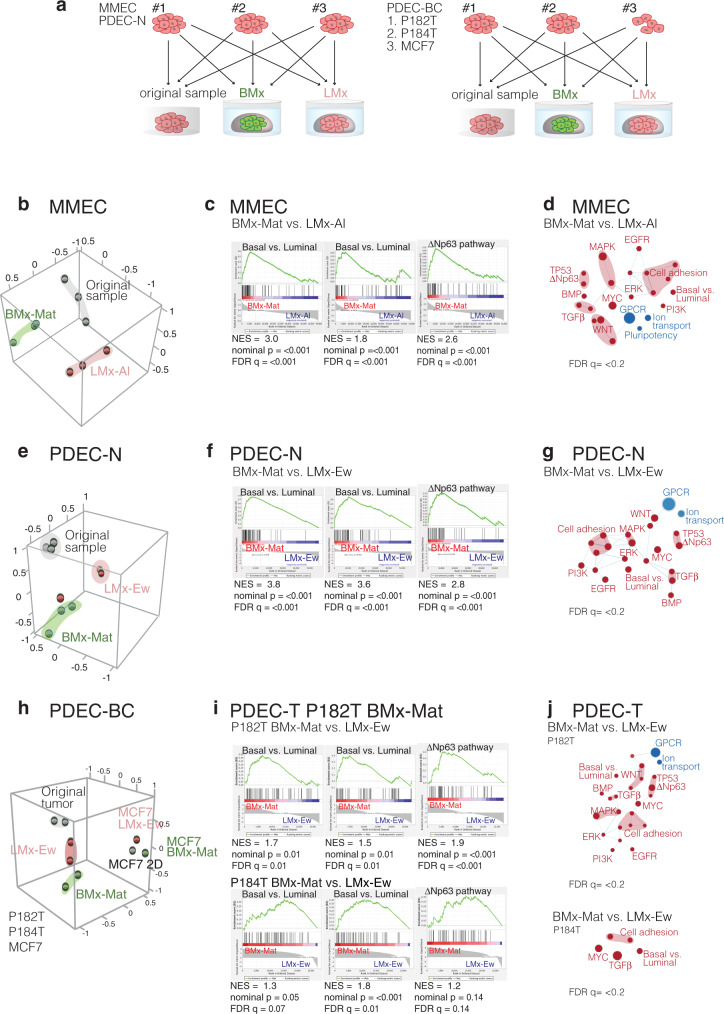
Fig. 3. Matrix alters transcriptomic profiles in the explant cultures.
a Experimental design. b, Principal components analysis (PCA) showing the matrix-dependent clustering of the MMECs. Mammary epithelial tissue samples were collected from three different mice and each sample was divided into three parts. One part remained uncultured (grey), the second part was cultured in BMx-Mat (green), and the third part was cultured in LMx-Al (pink) for 7 days. c The gene-set enrichment analysis (GSEA) shows the enrichment of the basal epithelial cell identity-associated gene sets in the explants grown in BMx matrix. d Cytoscape’s Enrichment map shows enrichment of basal phenotype-associated gene-sets in BMx-cultured explants as compared with LMx-cultured explants. Node size: number of genes in the signature; node color: red—enrichment in BMx-Mat vs LMx, blue—underrepresented in BMx-Mat. See the full maps in Supplementary Fig. 4. e, f, PCA, GSEA, and enrichment map similar as in b–d for PDEC-N e–g, and for two PDEC-BCs (P182T, P184T) and MCF7 breast cancer cells grown in 2D h–j. Abbreviations: NES: normalized enrichment score, FDR q: false discovery rate.

