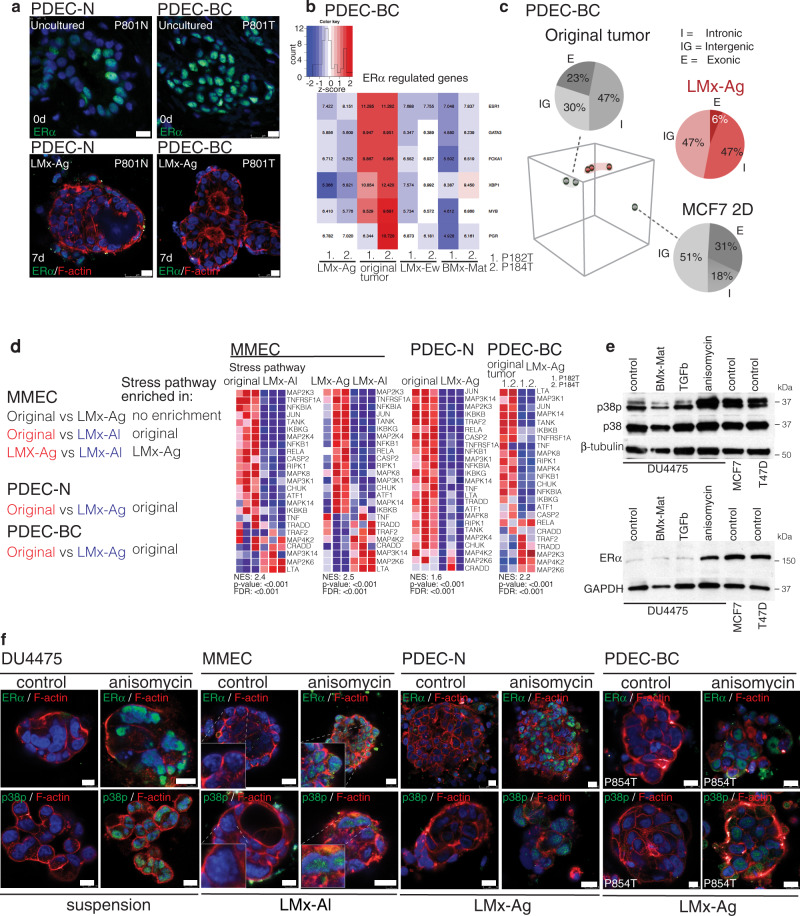
Fig. 5. Stress signaling is required for ERα expression.
a Immunofluorescence staining of ERα (green) in uncultured PDEC-N and PDEC-BC samples and after 7 days in a LMx-Ag matrix. N = 5 explants examined from 3 biologically independent samples. b The heatmap shows the expression of ERα-regulated gene sets in PDEC-BCs (P182T and P184T) in different matrices in comparison to the uncultured original samples. c PCA of RNAseq data obtained from PDEC-BC and MCF7 cells cultured in LMx-Ag matrix (red) for 7 days compared to the uncultured original tumor / 2D cultured MCF7 cells (grey). Pie charts show the relative distribution of exonic (E), intronic (I) and intergenic (IGR) transcripts in the RNA sequencing. d Heatmaps from GSEA analysis show the enrichment of stress pathway in MMECs, PDEC-N and PDEC-BCs. Different comparisons and the corresponding enrichments are shown in left. e Western blot analysis shows the effect from anisomycin treatment on p38p/p38 and ERα expression in the DU4475 TNBC cell line. TGFβ (2 ng/ml) serves as the negative control, while MCF7 and T47D are positive controls for the ERα (n = 3). f, Immunofluorescence staining of p38p in DU4475 cells, MMECs, PDEC-Ns, and PDEC-BCs in control and after anisomycin treatment. N = 6 explants examined from three biologically independent samples. Scale bar = 10 μm.

