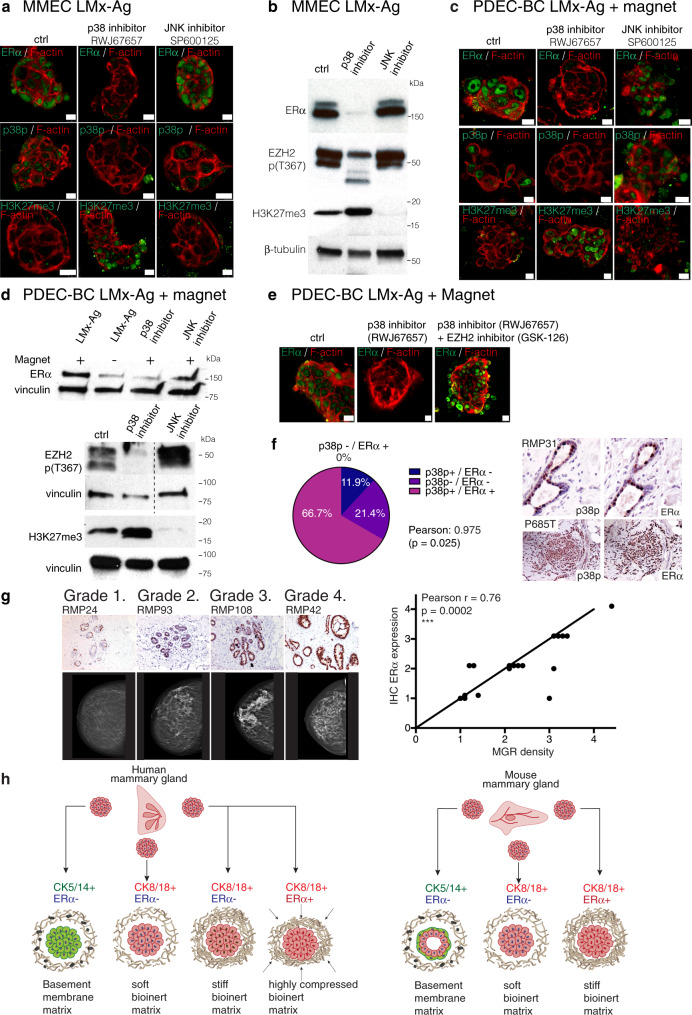
Fig. 7. Stress signaling and breast density associates with enhanced ERα expression in women.
a Immunofluorescent staining of p38p, ERα, and H3K27me3 expression in LMx-Ag cultured MMECs after p38 (RWJ67657) and JNK (SP600125) inhibition. N = 4 explants examined from five biologically independent samples. b Western blot images of ERα, EZH2 p(T367), and H3K27me3 expression in LMx-Ag cultured MMECs after p38 (RWJ67657) and JNK (SP600125) inhibition (n = 3). c Immunofluorescent staining of p38p, ERα, and H3K27me3 expression in magnetic compressed LMx-Ag cultured PDEC-BCs after p38 (RWJ67657) and JNK (SP600125) inhibition. N= 4 explants examined from five biologically independent samples. d Western blot images of EZH2 p(T367), H3K27me3, and ERα (with and without magnet) expression in magnet compressed LMx-Ag cultured PDEC-BC after p38 (RWJ67657) and JNK (SP600125) inhibition (n= 3). e Immunofluorescent images of magnet compressed PDEC-BCs treated with and without p38 inhibitor (RWJ67657) and EZH2 inhibitor (GSK-126). Expression of ERα is shown in green and F-actin is shown in red. N= 4 explants examined from five biologically independent samples. f Immunohistological staining of phosphorylated p38 and ERα in reduction mammoplasty (RMP) and breast cancer samples (PxxxT). The pie chart shows the coincidence of ERα and phospho-p38 expression in breast cancer samples (n = 42). Sequential sections were stained. The statistical significance was calculated between two cohorts (a: n = 17 and b: n = 25) using 2-sided Pearson’s correlation test, indicating that the values in the four classifications are linearly correlated between the two data sets. g, Correlation between ERα+ positivity and the breast mammographic density (MGR) in reduction mammoplasty samples. Grade 1: samples with 10–24% of ERα positive cells; Grade 2. Samples with 25–49% of ERα+ cells; Grade 3. Samples with 50–74% of ERα+ cells; Grade 4. Samples with 75–100% of ERα+ cells. N = 18 from biologically independent samples. h Model figure summarizing the main findings. Scale bar 10 μm.

