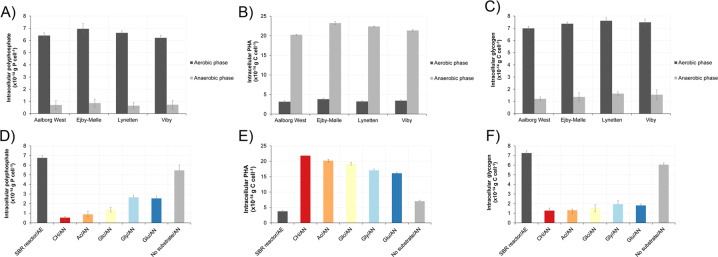
Fig. 4. Dynamics of storage polymers in Ca. D. phosphoritropha.
The content was measured by Raman microspectroscopy in FISH-defined cells by end of aerobic and anaerobic phases. A Poly-P levels in Ca. D. phosphoritropha in different full-scale EBPR plants. B PHA dynamics in Ca. D. phosphoritropha in different full-scale EBPR plants. C Glycogen dynamics in Ca. D. phosphoritropha in different full-scale EBPR plants. D Poly-P dynamics in Ca. D. phosphoritropha in SBR reactor fed with different substrates. E PHA dynamics in Ca. D. phosphoritropha in SBR reactor fed with different substrates. F Glycogen dynamics in Ca. D. phosphoritropha in SBR reactor fed with different substrates. SBR reactor is the initial sample collected at the end of the aerobic phase. CH = casein hydrolysate, Ac = acetate, Glc = glucose, Gly = glycine, Glu = glutamate. The sample indicated as “no substrate” has not been amended with additional substrate during anaerobic phase (control). AE = aerobic. AN = anaerobic.

