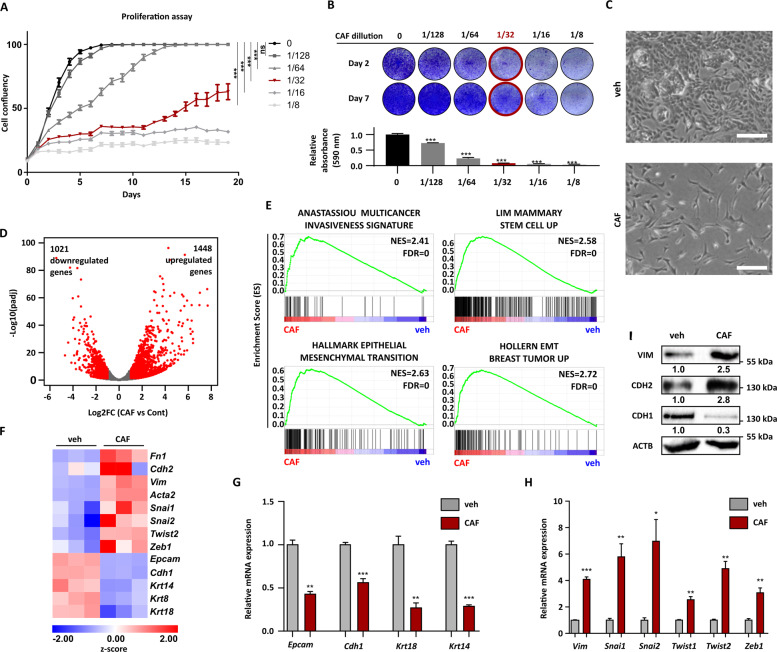
Fig. 1. WAP-T cells surviving a conventional cytotoxic combination therapy (CAF) gain stem cell traits and EMT properties in vitro.
A Cell proliferation assay of pG-2 cells treated for 48 h with increasing concentrations of a combinatory CAF chemotherapy. The concentrations represent a fraction of the dose used in our previous publication [31]. Cell confluency was assessed every day with a Celigo®. B Crystal violet staining of pG-2 cells performed on days 2 and 7 after different doses of CAF-chemotherapy. A quantification (absorbance at 590 nm) of solubilized crystal violet at day 7 is provided in the lower panel. C Phase contrast images of pG-2 cells 48 h after CAF-treatment showing a spindle-like morphology characteristic for cells that underwent EMT (scale bar = 250 µm). D Volcano plot showing transcriptome-wide gene expression changes in pG-2 cells treated with CAF for 48 h compared to vehicle. The number of regulated genes regulated upon CAF-treatment in the mRNA-seq analyses treatment was assessed using the following parameters: |log2FC | > 1 and p-adj < 0.05. E Representative GSEA enrichment plots showing significant enrichment of gene signatures characteristic for EMT-processes, stemness traits, and cancer aggressiveness in CAF-treated versus control pG-2 cells. F Heatmap showing the regulation of selected EMT markers identified in the mRNA-seq analyses in CAF-treated versus control pG-2 cells. G and H qRT-PCR results validating the downregulation of epithelial marker (G) and the upregulation of mesenchymal marker (H) upon CAF-treatment of pG-2 cells. Data were calibrated on the control condition and normalized on the Rplp0 housekeeping gene. I: Western blot validating an increase of Vimentin and N-cadherin protein levels as well as a decrease of E-Cadherin protein levels upon 48 h CAF treatment of pG-2 cells. Error bars: standard error of the mean (SEM), *p-val ≤ 0.05, **p-val ≤ 0.01, ***p-val ≤ 0.005, One-way ANOVA: A (AUC: area under the curve), B Student’s t-test: G, H All experiments were performed in at least biological triplicates (n = 3).

