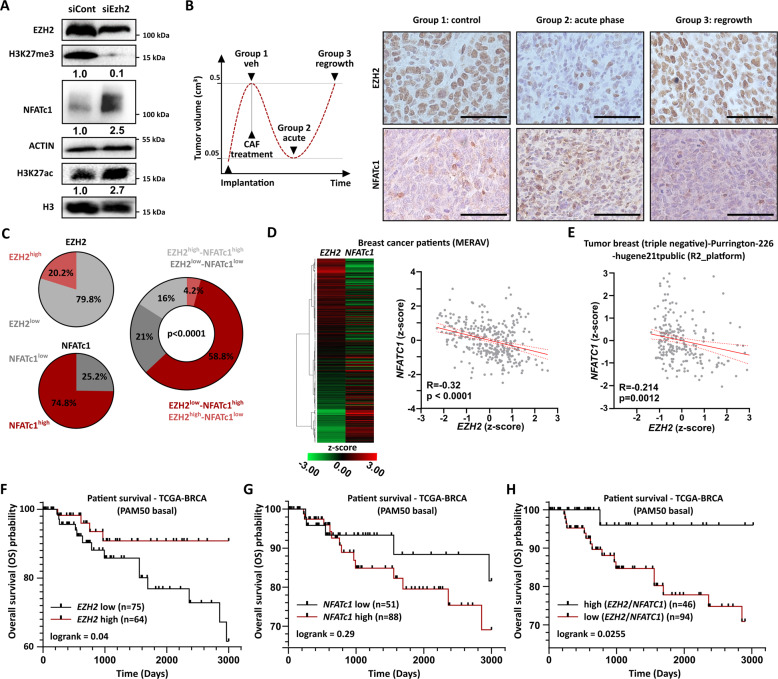
Fig. 5. EZH2 loss stimulates NFATc1 expression and correlates with poor prognosis in BLBC patients.
A siRNA-mediated EZH2 knockdown leads to a global loss of H3K27me3 and increased NFATc1 protein levels in pG-2 cells, as assessed by western blot. The densitometry values provided here represent H3K27me3/H3, NFATc1/Actin, and H3K27ac/H3 signals, respectively. B Schematic representation of the groups of CAF-treated tumors from Jannasch et al. [31] (left panel). Representative images of paraffin-embedded tumors from group 1 (control), group 2 (acute phase), and group 3 (regrowth phase) stained for EZH2 and NFATc1 (right panel). Scale bar = 50 µm. C Expression levels of EZH2 and NFATc1 alone (left charts) and anti-correlated with each other (right chart) in BC TMA samples (n = 119). D and E Distribution of EZH2 and NFATc1 expression levels in Metabolic gEne RApid Visualizer database (D; MERAV; http://merav.wi.mit.edu) and R2: Genomics Analysis and Visualization Platform (E; https://hgserver1.amc.nl/cgi-bin/r2/main.cgi). A significant anti-correlation between EZH2 and NFATc1 expression was observed (D and E). F–H Survival analyses of BLBC patients (PAM50 classification) showing overall survival (OS) advantage for the EZH2high (F) or EZH2high/NFATC1low (H) and a poorer survival for the NFATC1high (G) and EZH2low/NFATC1high (H) -expressing groups (H: based on the z-score (EZH2)/z-score(NFATc1) ratio). Expression and survival data of BLBC patient data were extracted from the TCGA-BRCA dataset on the Xena browser (link: https://xenabrowser.net/). Statistical tests: Fisher exact test (C), Pearson correlation (D, E), Log-rank test (F–H). All experiments were performed in at least biological triplicates (n = 3).

