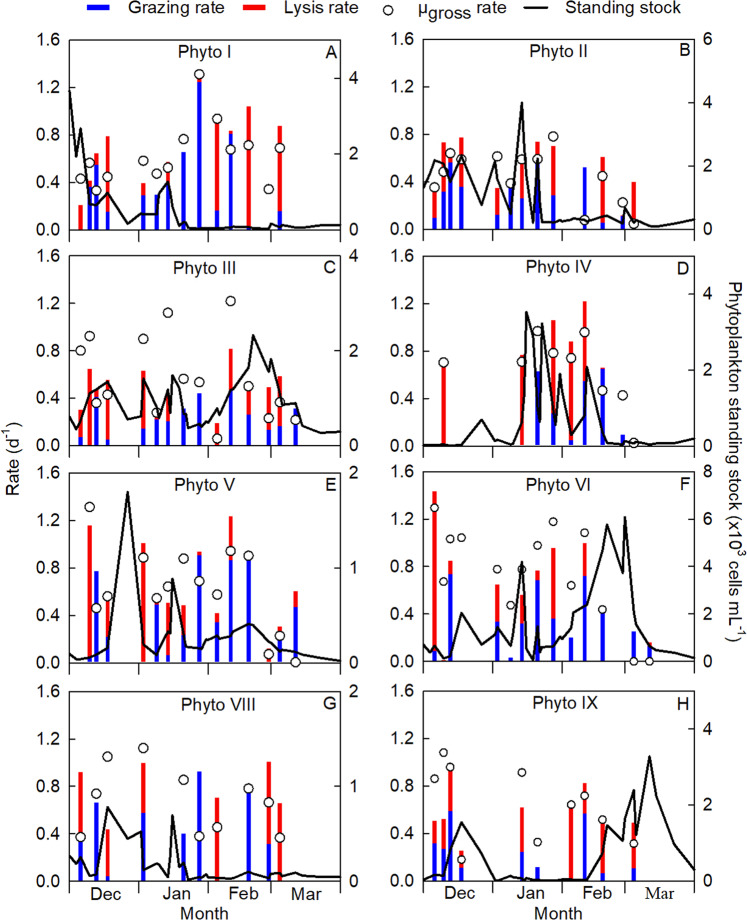
Fig. 1. Seasonal dynamics of phytoplankton standing stock (green line), specific gross growth rate (µgross; open circles), viral lysis rate (red bars) and grazing rate (blue bars) for different phytoplankton groups distinguished by flow cytometry.
The phytoplankton groups include (A, B) picoeukaryotes (Phyto I and II), (C) Phaeocystis (Phyto III), (D) cryptophytes (Phyto IV), and (E–H) diatoms of different size classes (Phyto V, VI, VIII and IX). Note that the scale for standing stock (right y-axis) differs between the panels; standing stock data are composed of n = 41 data points.

