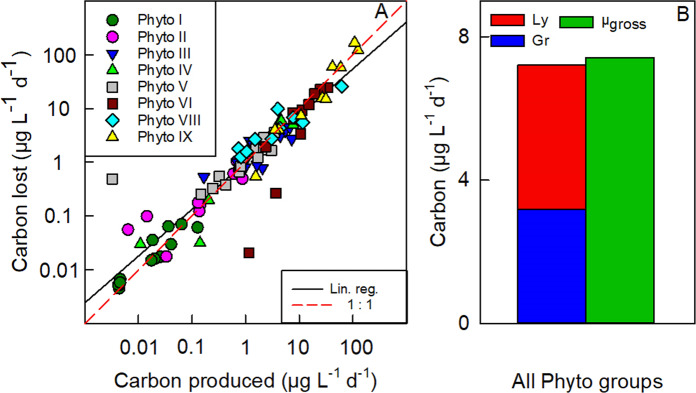
Fig. 5. Seasonal phytoplankton carbon production and losses.
A Daily phytoplankton carbon lost by viral lysis and grazing plotted against daily carbon produced by gross growth of the phytoplankton populations. Different data points are from rate measurements at different time points during the season. B Seasonal mean of total phytoplankton carbon lost by viral lysis (Ly) and grazing (Gr) and total carbon produced by gross growth, overall phytoplankton groups. The regression line (solid black line) in (A) has a slope of 0.87 (R2 = 0.87; p < 0.0001, n = 95). Note: zeros (n = 1) and negative (n = 2) values were excluded from log transformed carbon data in (A).

