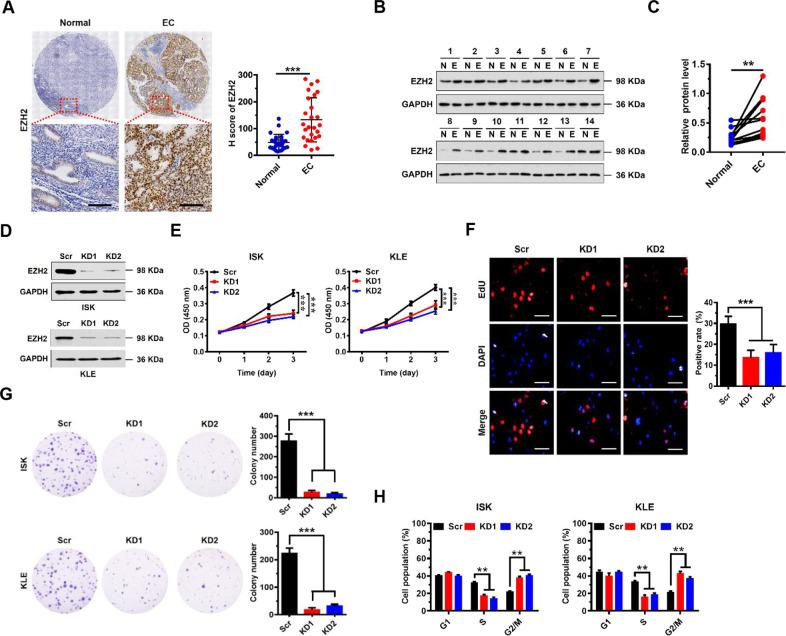
Fig. 1. Upregulation of EZH2 correlates with poor prognosis in EC, and promotes EC cell proliferation in vitro.
A Immunohistochemical (IHC) staining of EZH2 protein in EC and matched human normal tissues (as indicated). Representative micrographs are shown in original magnification (×400). Scale bars, 50 μm. Total IHC score of EZH2 in EC and matched human normal tissues (n = 26, right). ***P < 0.001 compared to the Normal control. B Western blot analysis of EZH2 in cell lysates from normal (N) and EC tumor (E) tissues (n = 14). GAPDH served as a loading control. C EZH2 protein expression levels by quantitation of density of protein bands from western blot in EC tissues in (B) relative to the normal tissues (n = 14, **P < 0.01). D Western blot assay of EZH2 protein expression following EZH2 knockdown in ISK and KLE cells. GAPDH served as a loading control. E Proliferation of EC cells transfected with siRNA to EZH2 (EZH2 knockdown, KD1 or KD2) or scramble control (Scr) in both ISK and KLE cells. Values at the indicated time points represent mean ± SD from three independent tests; ***P < 0.001 vs. Scr control. F EdU proliferation analysis of the effect of siRNA KD of EZH2 on the growth of ISK cells compared to Scr controls. Scale bars, 25 μm; ***P < 0.001 vs. Scr control. G Colony formation assay of ISK cells with knockdown of EZH2 or scramble control; ***P < 0.001 vs. Scr control. H The percentages of ISK and KLE Scr or EZH2 knockdown cells in the G1, S, and G2/M phases analyzed by flow cytometry showing cell cycle distribution. Each histogram bar represents the mean ± SD of three independent experiments. **P < 0.01 vs. Scr control.

